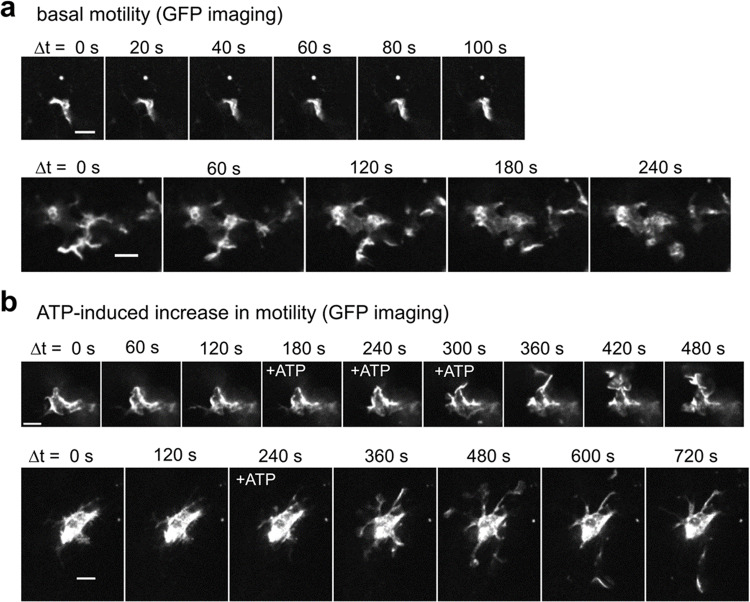
Fig. 6. Motility analysis of cerebellar microglia overexpressing GFP with our microglia-selective gene expression method.
a, b Time-lapse GFP fluorescent images (time indicated above the images) showing basal movements of microglial processes in a and ATP-induced motility upregulation of microglia in b (frames, when 100 µM ATP was bath-applied, are indicated as ‘+ATP’; 3 min ATP application in the upper panel and 1 min in the lower panel of b). The Upper and lower panels in a and b correspond to examples from different cells. Scale bars: 10 µm.

