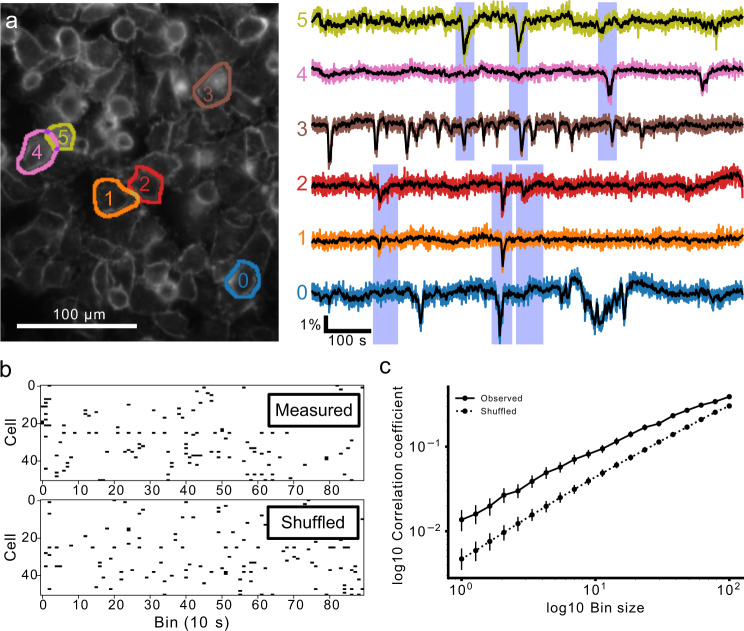
Fig. 9. Transient activity is temporally correlated in MDA-MB-231 cells.
a Example of temporally correlated cellular time courses from one FOV. Spatially separated cells (0,1,2) and (3,4,5) display synchronized hyperpolarisations. Importantly these synchronizations occur in different subsets of the groups and in spatially separated cells, indicating the synchronization is not simply due to cross-talk in the imaging. b Quantification of correlation. Events are put into time bins, generating cellular event rasters. The average pairwise correlation between cells in a recording was calculated. A null hypothesis of zero correlation with the same temporal statistics was generated by temporally shuffling each cell’s event raster to obtain an estimate of the expected level of correlation if there were no cellular synchronization. c The observed pairwise correlations are significantly higher in the observed data than shuffled data for all bin sizes, indicating that cellular activity is temporally correlated. The points plot the mean, and the bars indicate the 95% confidence interval for the measured and shuffled case for each bin size.

