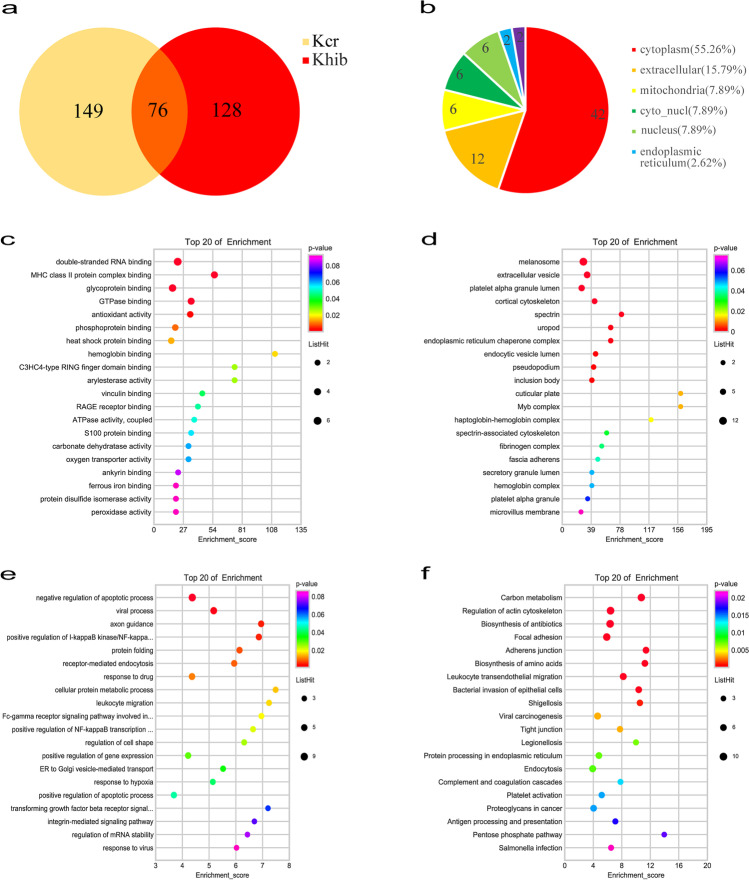
Fig. 1.
Differentially quantified proteins of lysine crotonylation and 2-hydroxyisobutyrylation between SLE patients and healthy people. (a) Venn diagram showing the DMPs. (b) Subcellular location of the DMPs. (c–f) GO enrichment analysis and KEGG pathway enrichment analysis of the DMPs. (c) Cellular component in the GO enrichment analysis. (d) Molecular function in the GO enrichment analysis. (e) Biological process in the GO enrichment analysis. (f) KEGG analysis of the DMPs

