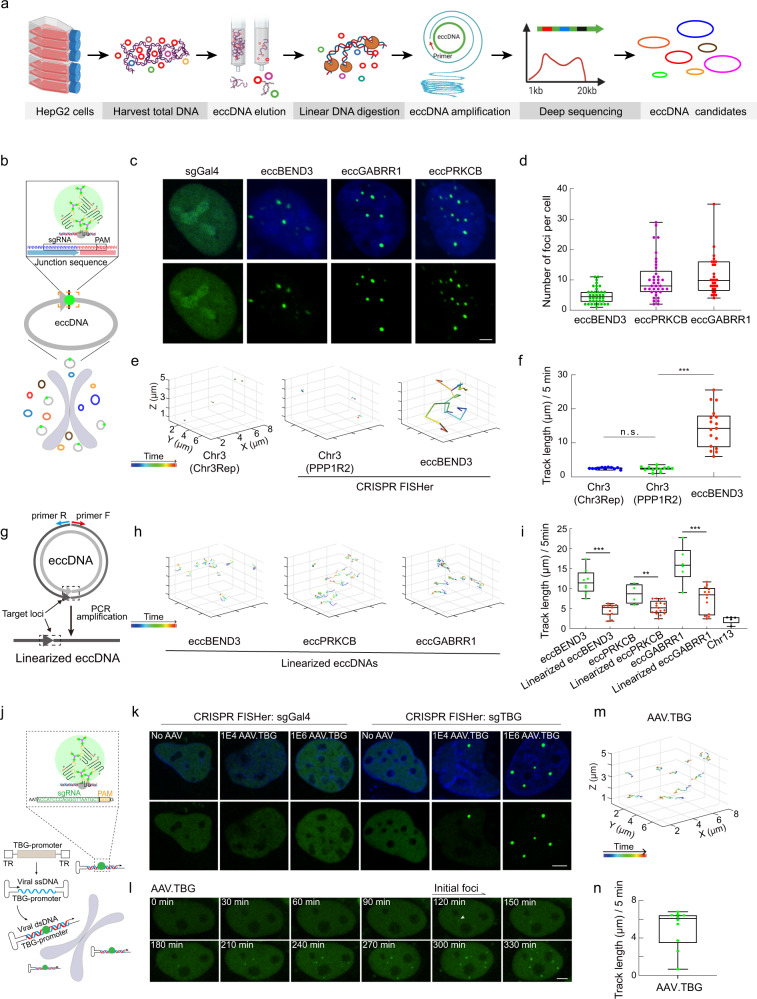
Fig. 6. CRISPR FISHer detection and real-time visualization of native extrachromosomal eccDNAs and invading AAV DNA in live cells.
a Schematic diagram of the isolation, enrichment, amplification, and deep sequencing of eccDNAs from HepG2 cells. b The schematic strategy of the eccDNA labeling with CRISPR FISHer. sgRNA target sites are located at junction regions of eccDNAs. c, d Representative images showing labeled eccDNAs by CRISPR FISHer in HepG2 cells (c) and the number of eccDNA foci (d). e Representative XYZ-t trajectories for eccBEND3 and Chr3 loci during a 5-min period. See Supplementary information, Videos S3‒S5 for dynamics. f Comparison of tracking length of eccBEND3 and Chr3 in HepG2 cells. Two-tailed Student’s t-test was performed (ns nonsignificance, ***P < 0.001). g The schematic diagram of the linearized eccDNA amplified from eccDNA by PCR. Dotted boxes indicate the CRISPR FISHer targeting locus as well as junction regions of eccDNA. h Representative XYZ-t trajectories for linearized eccDNAs during a 5-min period. See Supplementary information, Videos S9‒S11 for dynamics. i Tracking length of circular and linearized eccDNAs as well as Chr13. Two-tailed Student’s t-test was performed (ns nonsignificance, ***P < 0.001). j Schematic diagram showing the labeling strategy of adeno-associated virus (AAV) with CRISPR FISHer. k, l Representative images showing nuclear ds AAV DNA loci labeled by CRISPR FISHer in U2OS cells. The appearance and increasing formation of ds AAV DNA foci over time were shown in a single live cell (l). The sgRNA targeting mouse TBG carried by AAV was used. 1E4 or 1E6 particles of AAV.TBG was used for detection. m, n Representative trajectory (m) and tracking length (n) for ds AAV DNA loci in U2OS cells. See Supplementary information, Video S12 for dynamics. sgGal4 was used as the control sgRNA in c and k. Scale bars in c, k and l, 5 µm.

