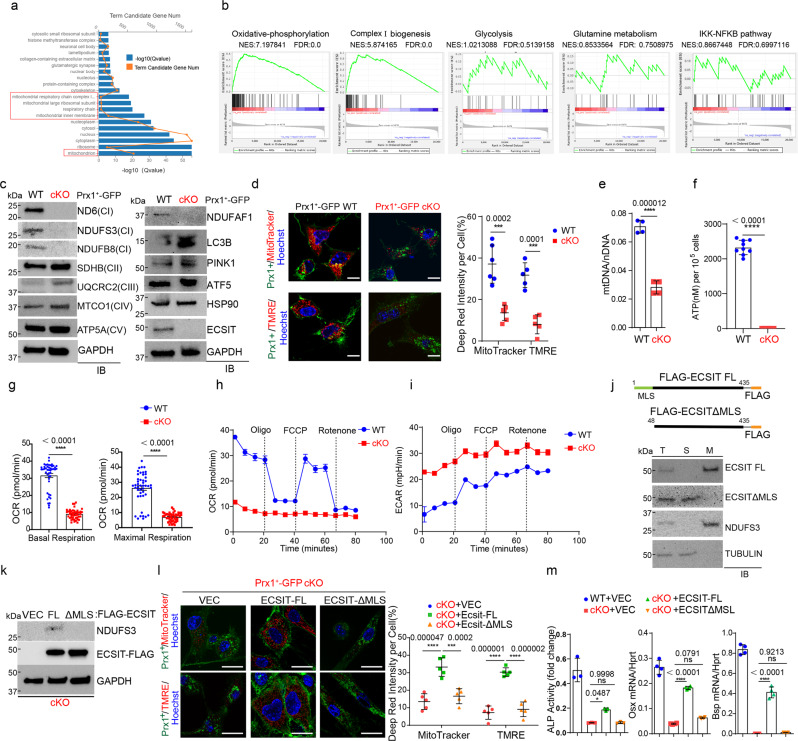
Fig. 2. Ecsit-deficiency in skeletal progenitors impairs mitochondrial OXPHOS.
a, b Gene ontology analysis showing biological processes with gene enrichment in cKO vs WT skeletal progenitors (a). Gene set enrichment analysis (GSEA) showing the enrichment of genes involved in OXPHOS, CI biogenesis, glycolysis, glutamine metabolism, and IKK-NFκB signaling (b). c Immunoblot analysis showing protein levels in cKO and WT skeletal progenitors. GAPDH was used for a loading control. d MitoTracker and TMRE staining (red) of GFP-expressing cKO and WT skeletal progenitors (green). DAPI was used for nuclear staining (left). The signal intensity of the stained cells was quantified using ImageJ software (right). (MitoTracker (WT), n = 6; MitoTracker (cKO), TMRE (WT, cKO), n = 5). e RT-PCR analysis showing the ratio of mitochondrial DNA (mtDNA, Ndufv1) to nuclear DNA (nDNA, 18s) in cKO and WT skeletal progenitors (n = 4). f Intracellular ATP levels in cKO and WT skeletal progenitors were measured by colorimetric analysis (n = 9). g–i. Seahorse assay showing a real time oxygen consumption rate (OCR, g–h) and extracellular acidification rate (ECAR, i) of cKO and WT skeletal progenitors before and after the addition of mitochondrial inhibitors (n = 46). j Diagram of constructs for ECSIT-full length and the mutant lacking mitochondrial localization sequence (MLS, 1-47 aa). A FLAG epitope tag was inserted into the C-terminus of ECSIT cDNA (top). Immunoblot analysis showing mitochondrial fractionation of FLAG-ECSIT proteins in cKO skeletal progenitors. (bottom). T total, S soluble, M mitochondrial fraction. k Immunoblot analysis showing expression of FLAG-ECSIT proteins in AAV-transduced cKO skeletal progenitors. l, m MitoTracker or TMRE staining of vector control or FLAG-ECSIT-expressing cKO and WT skeletal progenitors and quantification of deep red signal intensity (l). AAV-transduced cells were cultured under osteogenic conditions and ALP activity and osteogenic gene expression were assessed (m, n = 4). A two-tailed unpaired Student’s t-test for comparing two groups (d, e, f, g) or ordinary one-way ANOVA with Dunnett’s multiple comparisons test (l,m). (d–i, l–m; data represent mean ± SD). Data (e, f, g, m) are representative of three independent experiments. Scale bars = d (left), l, 10 μm.

