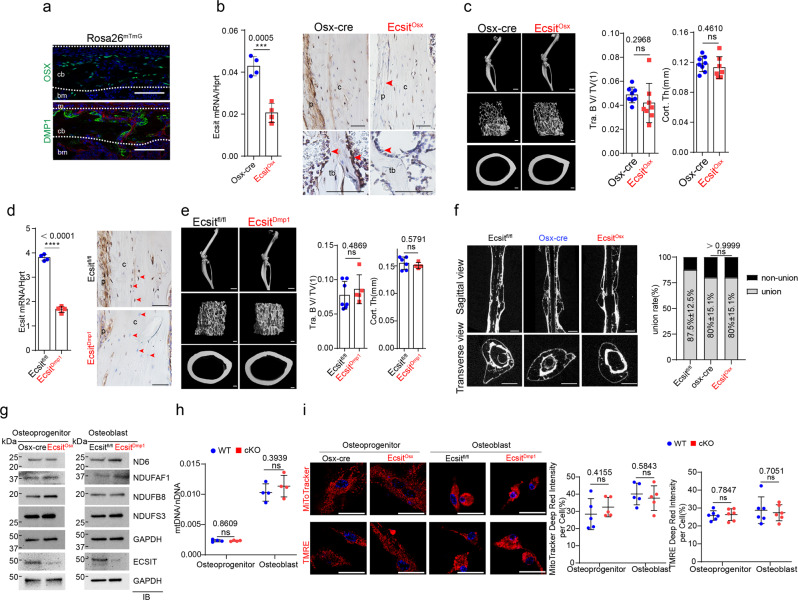
Fig. 4. EcsitOsx and EcsitDmp1 mice show no skeletal phenotype and intact mitochondrial function.
a GFP-expressing Osterix (OSX)-, DMP1-lineage cells residing in the diaphyseal periosteum of P1 Osx-EGFP and DMP1-cre;Rosa26mTmG mice, respectively, were monitored by fluorescence microscopy. m: muscle, bm: bone marrow. b, d mRNA levels of Ecsit in tibia was examined by RT-PCR (n = 4, left). Immunohistochemistry showing ECSIT expression in 2-month-old EcsitOsx, EcsitDmp1, and littermate control femurs (right). p: periosteum, tb: trabecular bone, c: cortical bone. Red arrows indicate Osx+ or Dmp1+ lineage osteoblasts or osteoctyes. c, e MicroCT analysis showing 3D-reconstruction images of hindlimbs, femoral trabecular and cortical bones of 2-month-old EcsitOsx, EcsitDmp1 and littermate control mice (left), and the relative quantification of trabecular bone mass (Osx-cre, EcsitOsx, n = 8; Ecsitfl/fl, n = 7; EcsitDmp1, n = 5) and cortical bone thickness (Osx-cre, n = 8; EcsitOsx, n = 7; Ecsitfl/fl, n = 6; EcsitDmp1, n = 4, right). Osx-cre limbs were used as controls for EcsitOsx mice. f MicroCT analysis showing sagittal and transverse views of fracture sites of 2-month-old Osx-cre, EcsitOsx, and Ecsitfl/fl femurs 10 weeks after the surgery, and the relative quantification of fracture union rates (n = 5). g–i Osteoprogenitors and osteoblasts were isolated from Osx-cre and EcsitOsx calvaria and Ecsitfl/fl and EcsitDmp1 long bones, respectively. Immunoblot analysis showing protein levels in the isolated cells. GAPDH was used as a loading control (g). A ratio of mtDNA (Ndufv1) to nDNA (18s) was assessed by RT-PCR (n = 4, h). Fluorescence microscopy shows MitoTracker- and TMRE-stained cells (i, left) and relative quantification of MitoTracker- (n = 5, i, middle) and TMRE-red signal intensity (n = 5, i, right). A two-tailed unpaired Student’s t-test for comparing two groups (b, c, d, e, h, i; error bars, data represent mean ± SD) or a Fisher’s exact test (f, p > 0.9999) was applied. Data are representative of three independent experiments. Scale bars = a, 75 μm; b, d, 100 μm; c, e (left, top) 2 mm; c, e (left, middle and bottom), 100 μm; f, 1 mm; i (left), 25 μm.

