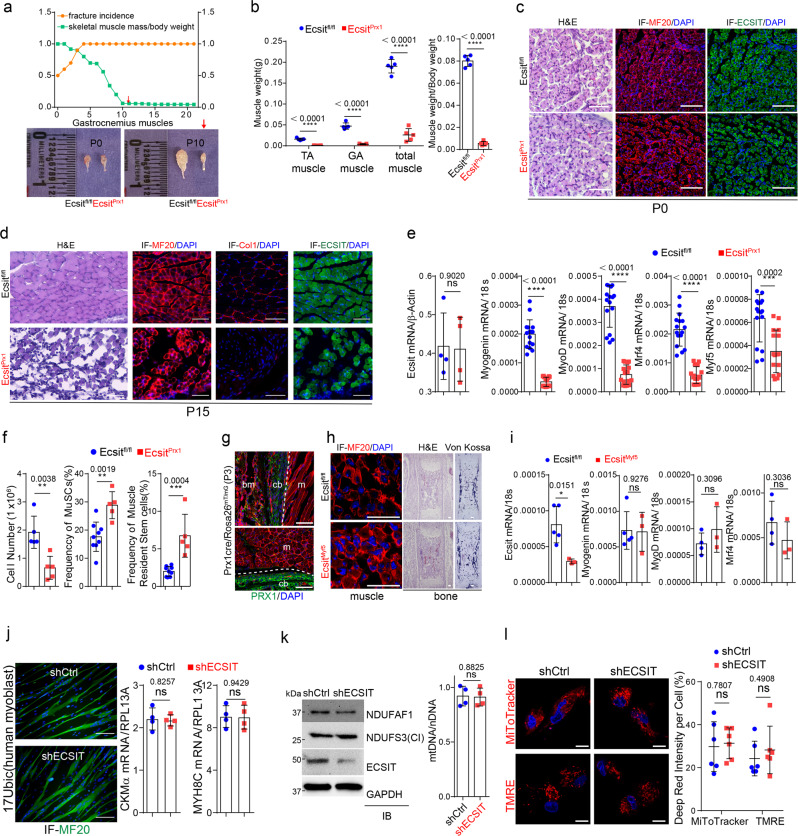
Fig. 5. EcsitPrx1 mice display skeletal muscle atrophy.
a Graph shows the kinetics of fracture incidence and skeletal muscle weight of EcsitPrx1 and Ecsitfl/fl mice (n = 5, left). Representative macroscopic images of the gastrocnemius (GA) muscle at the age of P0 and P10 (right). b Quantification of skeletal muscle weight (left) and a ratio of skeletal muscle weight to body weight (right) are displayed (n = 5). c, d P0 (c) or P15 (d) EcsitPrx1 and Ecsitfl/fl tibialis anterior (TA) muscles were stained for H&E or immunostained for MF20, COL1α1, or ECSIT. e mRNA levels of myogenic genes in P10 EcsitPrx1 and Ecsitfl/fl TA muscles (n = 16). f Total cell number (n = 5) and flow cytometry analysis showing the frequency of muscle satellite cells (MuSCs) and skeletal muscle resident stem/progenitor cells (Ecsitfl/fl, n = 9, EcsitPrx1, n = 5) in P10 EcsitPrx1 and Ecsitfl/fl GA muscles. Supplemental Fig. 11 demonstrates the gating strategy for this analysis. g GFP-expressing Prx1+ skeletal cells in P3 Prx1-cre;Rosa26mTmG GA muscle. Red: Prx1- bone marrow and muscle. h, i Tibialis anterior muscles or femurs of E21 EcsitMyf5 and Ecsitfl/fl embryos were stained for H&E, Von Kossa, or immunostained for MF20 (h). mRNA levels of Ecsit and myoblast genes in the skeletal muscle (i, Ecsitfl/fl, n = 4−5; EcsitMyf5, n = 3). j Human 17Ubic myoblasts expressing control (shCtrl) or ECSIT shRNA (shECSIT) were cultured under myogenic conditions. 6 days later, expression of MF20 (green) and myogenic genes was assessed (n = 4). k, l Protein levels of NDUFAF1, ECSIT and NDUFS3 (k, left) or the ratio of mtDNA (Ndufv1) to nDNA (18s, k, right) in shCtrl or shECSIT-expressing 17Ubic cells. Fluorescence microscopy shows MitoTracker- and TMRE-stained cells and relative quantification of deep red signal intensity (n = 6, l). A two-tailed unpaired Student’s t-test for comparing two groups (b, e, f, i, j, k, l; error bars, data represent mean ± SD). Data are representative of three independent experiments. Scale bars = c, d, 60 μm; g, 75 μm; h, 30 μm; j, 100 μm; l, 10 μm.

