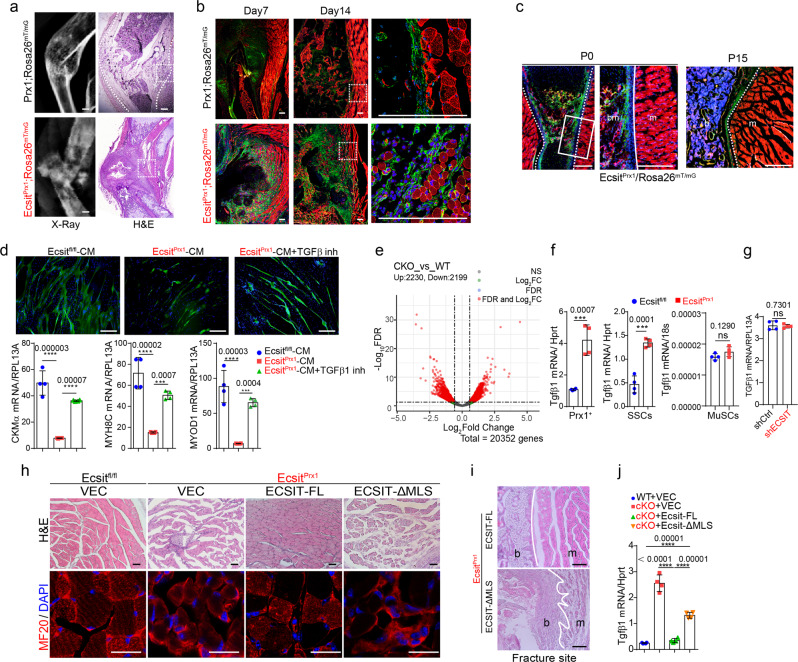
Fig. 6. EcsitPrx1 skeletal progenitors induce skeletal muscle degeneration.
a X-radiography (left) and H&E staining (right) of P14 Ecsit;Prx1Rosa26mTmG tibias with spontaneous fractures and 6-week-old Prx1;Rosa26mTmG tibias 14 days post-fracture surgery. b Fluorescence microscopy showing GFP-expressing Prx1+ skeletal cells in P7 or P14 Ecsit;Prx1Rosa26mTmG tibias with spontaneous fracture and 6-week-old Prx1;Rosa26mTmG tibias 7- or 14-days post-fracture surgery. Red: Prx1- tissues. c Non-fractured sites in P0 (left) or P15 (right) Ecsit;Prx1Rosa26mTmG femurs, demonstrating intact skeletal muscle structure. Green: Prx1+ skeletal cells. Red: Prx1- bone marrow and muscle. d Human 17Ubic myoblasts were cultured under myogenic conditions in the presence of conditioned medium (CM) harvested from the culture of FACS-sorted Ecsit;Prx1Rosa26mTmG (cKO) and Prx1;Rosa26mTmG (WT) skeletal progenitors. 5 days later, expression of MF20 (green) and myogenic genes was assessed (n = 4). Alternatively, cells were treated with the TGF-β1 inhibitor SB431542. e RNA sequencing was performed on FACS-sorted Ecsit;Prx1Rosa26mTmG (cKO) and Prx1;Rosa26mTmG (WT) skeletal progenitors. A volcano plot shows the gene expression for up/downregulated genes in cKO cells relative to WT cells. f mRNA levels of Tgf-β1 in FACS-sorted skeletal progenitors (left), SSCs (middle), or skeletal muscle satellite cells (MuSCs, right) (n = 4). g mRNA levels of Tgfβ1 in 17Ubic myoblast progenitors expressing control (shCtrl) or ECSIT shRNA (shECSIT) (n = 4). h, i AAV-treated Ecsitfl/fl and EcsitPrx1 TA muscles (P21) were stained for H&E (h, top) or immunostained for MF20 (h, bottom). H&E staining demonstrate intact cortical bone, periosteum, and skeletal muscle in EcsitPrx1 mice expressing FLAG-tagged ECSIT-FL, not ECSIT-ΔMLS (i). White lines indicate the barrier between bone and skeletal muscle. j mRNA levels of Tgf-β1 in vector control or FLAG-ECSIT-expressing cKO and WT skeletal progenitors (n = 4). A two-tailed unpaired Student’s t-test for comparing two groups (f, g) or ordinary one-way ANOVA with Dunnett’s multiple comparisons test (d, j) (d, f, i, data represent mean ± SD). Data are representative of three independent experiments. Scale bars = a, c, 200 μm; b, d, 100 μm; h, 75 μm; i, 20 μm.

