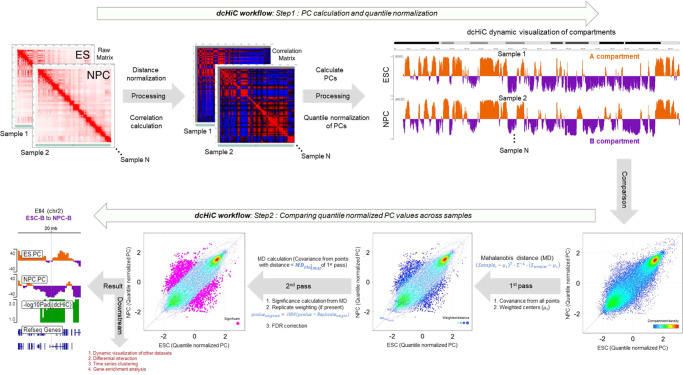
Fig. 1. Outline of the method.
The figure panel shows the dcHiC workflow in two steps. In step 1, dcHiC calculates the principal components followed by the quantile normalization of the compartment scores across all input Hi-C data. In step 2, for each genomic bin, dcHiC calculates the Mahalanobis distance, a multi-variate z-score that measures the extent to which each bin is an outlier with respect to the overall compartment score distribution across all input Hi-C maps (Methods - differential compartment identification). dcHiC then utilizes the Mahalanobis distance to assign a statistical significance using the chi-square test (p-value) for each compartment bin and employs independent hypothesis weighting (IHW – when there are replicate samples) or FDR (when no replicates are available) correction on these p-values. dcHiC outputs a standalone dynamic IGV web browser view and enables the user to integrate other datasets into the same view for an integrated visualization. Source data are provided as a Source Data file.

