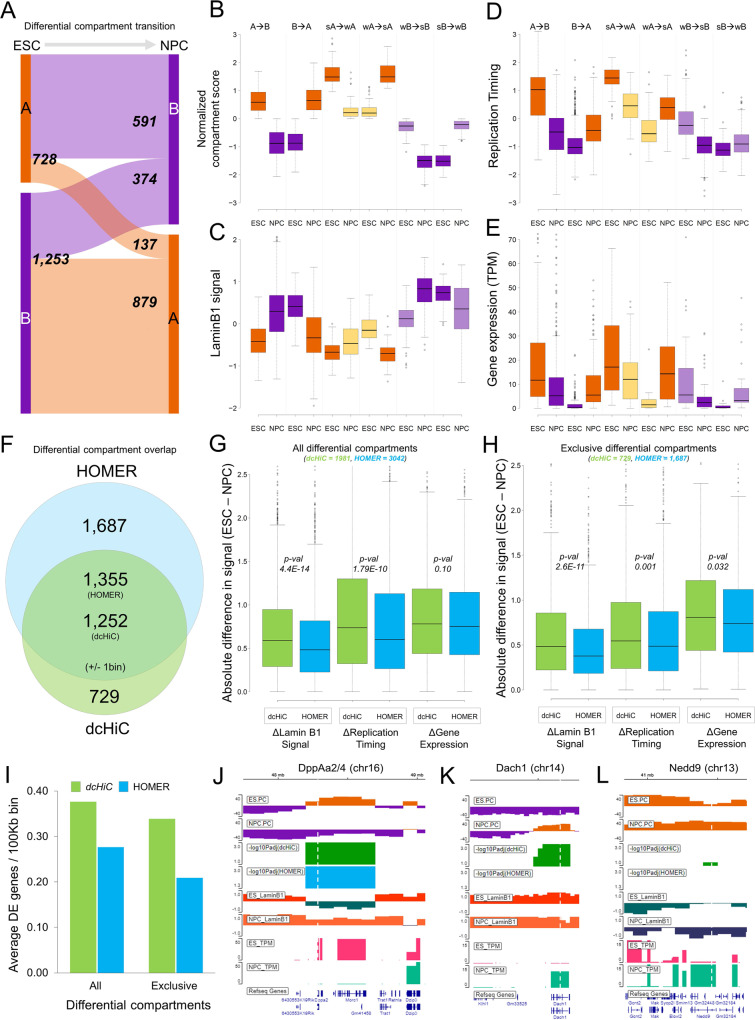
Fig. 3. Pairwise differential compartment analysis between ESCs and NPCs.
A The breakdown of the numbers of differential compartment calls (100 kb resolution) belonging to different types. A compartments are in orange and B compartments are in purple. B–E The distributions of compartment scores, replication timing, Lamin B1 signal and gene expression values for all statistically significant compartment changes identified by dcHiC. Strong (s) and weak (w) were used to indicate the relative compartment strength (or absolute value) between the two cell types. The breakdown of differential compartment calls across different subtypes with respect to compartment association were: A->B n = 659; B->A, n = 819; sA->wA, n = 70; wA->sA, n = 50; wB->sB, n = 168; sB->wB, n = 222 for each subpanel with zero or N/A values removed from each data type. F The Venn diagram shows the overlap between dcHiC (green) and HOMER (blue) differential compartment calls. G, H The absolute difference in Lamin B1, replication timing signal and gene expression values (TPM) overlapping with all and exclusive differential compartments identified by dcHiC and HOMER, respectively (statistical significance was calculated by unpaired, two-sided t-test). I The average number of differentially expressed (DE) genes overlapping with differential compartment bins (100 kb) identified by dcHiC and HOMER. J–L dcHiC differential compartments involving three DE genes: DppA2/4, Dach1 and Nedd9. In B–E, G, and H, data are presented as mean values ±SEM. Source data are provided as a Source Data file.

