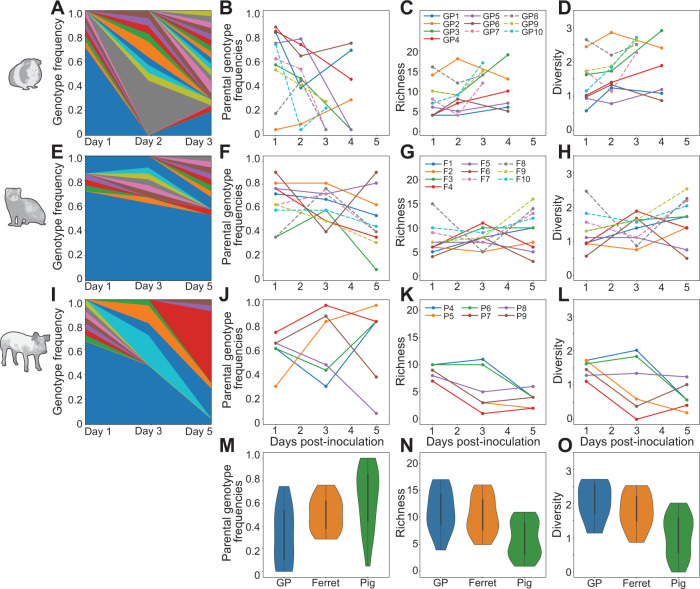
Fig. 1. Viral genotypic diversity generated through reassortment in the mammalian nasal tract.
Results from guinea pigs are shown in A–D, ferrets in E–H, and swine in I–L. Stacked plots (A, E, I) show frequencies of unique genotypes detected in one representative animal over time. Blue and orange represent the WT and VAR parental genotypes, respectively. The frequency of both parental genotypes combined (B, F, J), richness (C, G, K), and Shannon–Weiner diversity (D, H, L) are each plotted as a function of time. Guinea pigs and ferrets inoculated at high dose (1 × 10⁵ ID50) and low dose (1 × 10² ID50) are indicated with dashed and solid lines, respectively. The distribution of parental genotype frequencies (M), richness (N), and diversity (O) across all time points in each species (guinea pigs n = 12; ferrets n = 12; swine n = 18) is shown with violin plots. Data are presented as violin plots featuring a box plot. The bounds of the box show the first and third quartiles. Whiskers indicate 1.5 times the interquartile range and contain ~99% of the data for a normal distribution. The bounds of the violin plots indicate the minima and maxima of the entire dataset. Differences in richness and diversity between swine and guinea pigs (richness p = 0.00065; diversity p = 0.00014) and between swine and ferrets (richness p = 0.0016; diversity p = 0.0028) were significant. Parental genotype frequencies differed significantly between swine and guinea pigs (p = 0.003) and were not significant between swine and ferrets (p > 0.05). All statistics were derived using one-way ANOVA. Animal silhouettes were generated using BioRender.com.

