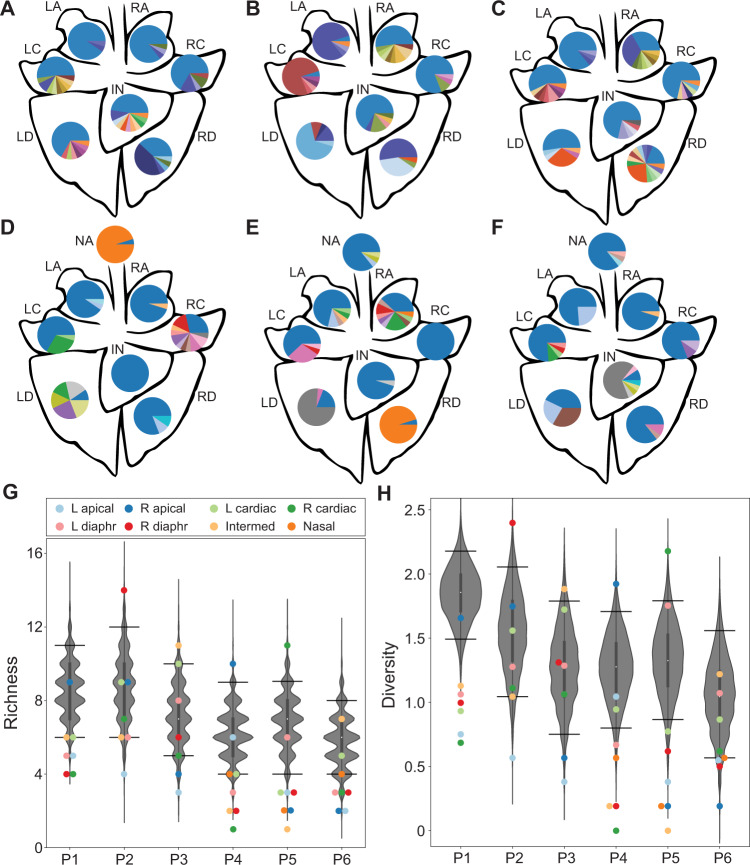
Fig. 4. Local diversity arising through reassortment is modest within the swine respiratory tract.
Pie charts showing frequencies of unique genotypes present within each lung lobe of a given pig on day 3 (A–C) and the nasal tract and each lung lobe of a given pig on day 5 (D–F) with blue and orange sections representing WT and VAR parental genotypes, respectively. The tissue sites are abbreviated as NA-Nasal; LA-Left Apical; RA-Right Apical; LC-Left Cardiac; RC-Right Cardiac; LD-Left Diaphragmatic; RD-Right Diaphragmatic; IN-Intermediate (accessory). Simulated richness (G) and diversity (H) are plotted, with observed results (colored points) overlaid on the distribution of simulated data (gray violins) (n = 1000 simulations per pig). Data are presented as violin plots featuring a box plot. The bounds of the box show the interquartile range and the center of the box shows the 50th percentile. The median is shown by the white dot. Whiskers indicate 1.5 times the interquartile range and contain of the data for a normal distribution. The bounds of the violin plots indicate the minima and maxima of the entire dataset. Horizontal lines denote the 95th and 5th percentiles.

