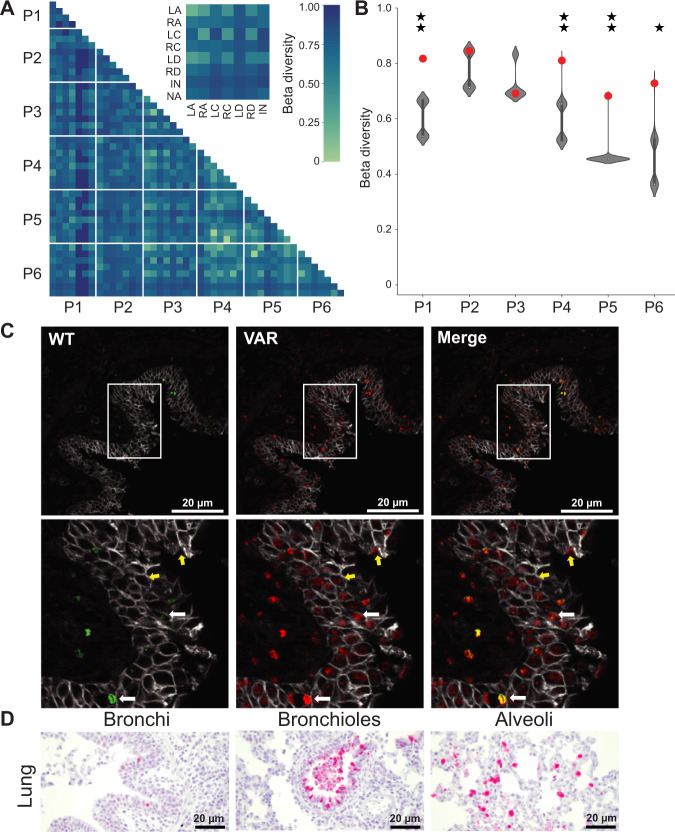
Fig. 5. Reassortant viral populations show extensive compartmentalization within the swine respiratory tract.
Heat map showing normalized beta diversity of viral populations in swine lung and nasal tract (A). The inset shows a representative comparison between the tissues of pigs P3 and P6, to indicate the position of each tissue within the matrix. The tissue sites are abbreviated as NA-Nasal; LA- Left Apical; RA- Right Apical; LC-Left Cardiac; RC-Right Cardiac; LD-Left Diaphragmatic; RD-Right Diaphragmatic; IN-Intermediate (accessory). Normalized beta diversity between the left apical and left cardiac lobes is plotted (B) with observed results (colored points) overlaid on the distribution of simulated data (gray violins) (n = 1000 simulations per pig). Data are presented as violin plots featuring a box plot. Data are presented as violin plots featuring a box plot. The bounds of the box show the interquartile range and the center of the box shows the 50th percentile. Whiskers indicate 1.5 times the interquartile range and contain of the data for a normal distribution. The bounds of the violin plots indicate the minima and maxima of the entire dataset. One star indicates that observed data is above the 95th percentile of the distribution; two stars indicates that observed data is above the 99th percentile. C Representative immunohistochemistry images of swine (P76) left apical lung section stained for WT (green) and VAR (red) viruses at day 3 post-inoculation. Gray staining marks epithelial cell borders. Yellow coloring in merged images indicates the presence of both WT and VAR HA antigens in the same cell. Zoomed insets of the lung are shown with white arrows indicating co-infected cells and yellow arrows indicating singly infected cells. Scale bars are 20 µm. Four fields were analyzed for each tissue section and representative images are depicted here. D Immunohistochemistry images of swine (P76) left apical lung sections stained for nucleoprotein (red) and counterstained with hematoxylin. Scale bars are 20 µm. Four fields were analyzed for each tissue section and representative images are depicted here.

