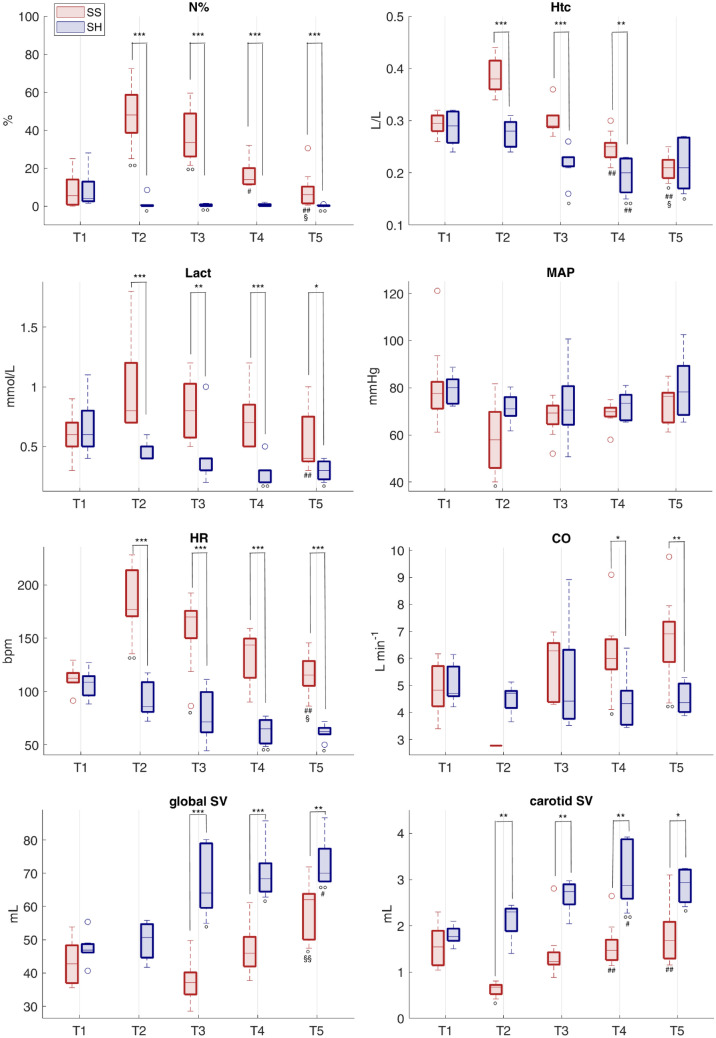
Figure 1.
Distributions of laboratory data and hemodynamic variables for the two groups at each time point. Comparison between Sepsis and Sham: *p-value < 0.05, **p-value < 0.01, ***p-value < 0.001 (Wilcoxon rank sum test). Wilcoxon signed test: °p-value < 0.05, °°p-value < 0.01 with respect to T1, #p-value < 0.05, ##p < 0.01 with respect to T2, §p-value < 0.05, §§p-value < 0.01 with respect to T3 (Friedman test p-value < 0.05). N% = band neutrophils, Htc = hematocrit, Lact = arterial lactate, MAP = mean arterial pressure, HR = heart rate, CO = cardiac output, global SV = global stroke volume, carotid SV = carotid stroke volume.

