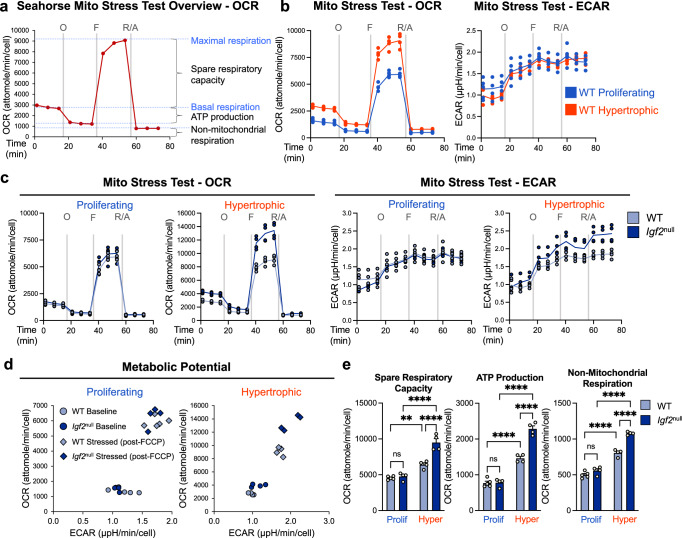
Fig. 2. Hypertrophic differentiation is characterized by a marked increase in oxidative phosphorylation that is further exacerbated by Igf2 deficiency.
a Schematic of expected oxygen consumption rate (OCR) readings for a Mito Stress Test in the Seahorse XFe96 metabolic analyzer, including injection points for oligomycin (O), FCCP (F), and rotenone/antimycin A (R/A). b Metabolic analysis: OCR and extracellular acidification rate (ECAR) of WT epiphyseal chondrocytes under proliferative and hypertrophic conditions. Note that the OCR curve for WT hypertrophic chondrocytes also appears in (a). c OCR and ECAR analyses of WT and Igf2 null epiphyseal chondrocytes under proliferative and hypertrophic conditions. Note that the WT lines in (c) are the same as those in (a) and (b). d Metabolic potential of WT and Igf2 null epiphyseal chondrocytes at baseline and after being stressed (post-FCCP injection). e Spare respiratory capacity, (mitochondrial) ATP production, and non-mitochondrial respiration as calculated from OCR measurements. Data are presented as individual measurements with a line indicating the mean where necessary (b, c, d) or individual measurements with mean + SEM (e), representative of n = 5 experiments with 3–6 wells per group. Statistical significance was calculated using a two-way ANOVA with Tukey’s test for multiple comparisons (e). p-values indicated as ns (not significant), *p < 0.05, **p < 0.01, ***p < 0.001, ****p < 0.0001.

