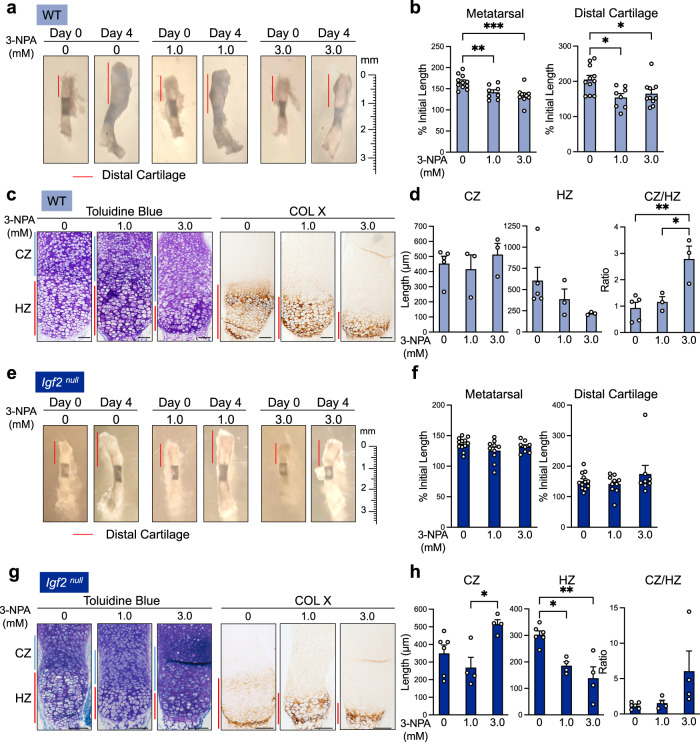
Fig. 5. Inhibition of oxidative phosphorylation in ex vivo metatarsal culture does not alter bone growth, but increases the length of the columnar zone at the expense of the hypertrophic zone.
a Images of WT metatarsal explants cultured for 4 days with and without 3-NPA. Representative of n = 8–11 bones per group. b Quantification of metatarsal and distal cartilage growth from the beginning of the culture period (as percent of initial length of metatarsal or distal cartilage). n = 8–11 bones per group. c Toluidine blue staining and collagen X (hypertrophic marker) IHC on ex vivo-cultured WT metatarsals treated with 3-NPA. Representative of n = 3–5 bones per group. CZ columnar zone. HZ hypertrophic zone. d Measurements of the lengths of the CZ and HZ, and the ratio of the CZ to the HZ, in ex vivo-cultured WT metatarsals treated with 3-NPA. n = 3–5 bones per group. e Igf2 null metatarsal explants cultured for 4 days with and without 3-NPA. Representative of n = 8–12 bones per group. f Quantification of metatarsal and distal cartilage growth from the beginning of the culture period (as percent of initial length of metatarsal or distal cartilage). n = 8–12 bones per group. g Toluidine blue staining for morphology and IHC for collagen X (hypertrophic marker) in Igf2 null metatarsals treated with 3-NPA. Representative of n = 4–6 bones per group. CZ columnar zone. HZ hypertrophic zone. h Measurements of the lengths of the CZ and HZ, and the ratio of the CZ to the HZ, in Igf2 null metatarsals treated with 3-NPA. n = 4–6 bones per group. Scale bar: 100 µm. Data are presented as individual measurements with mean + SEM. Note that the control data (0 mM 3-NPA) for b, d, f, and h are also shown in Fig. 7. Statistical significance was calculated one-way ANOVA with Sidak’s test for multiple comparisons (b, d, f, h). p-values indicated as *p < 0.05, **p < 0.01, ***p < 0.001.

