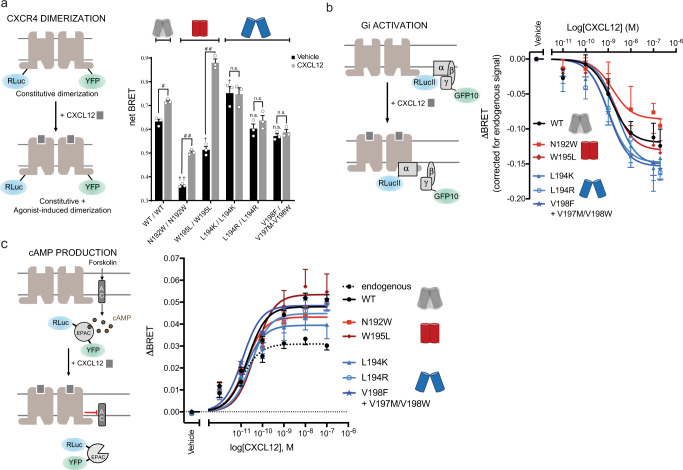
Fig. 3. CXCR4 association and Gi activation.
a (Left) Schematic representation of the CXCR4 dimerization BRET-based assay. (Right) CXCR4 association was measured by BRET before (black) and after agonist stimulation (gray) in HEK293T cells transfected with CXCR4-RLuc and its counterpart CXCR4-YFP, WT, or mutant as indicated. BRET480-YFP was measured after the addition of coel-h (10 min) and CXCL12 (15 min). Data shown represent the mean ± SEM of three independent experiments and are expressed as net BRET (calculated by subtracting background luminescence). Statistical significance was assessed using a two-way ANOVA followed by a Šídák’s multiple comparisons test: #p = 0.007, ##p < 0.0001, n.s. not significant p > 0.05 are used to compare BRET values between basal to CXCL12-treated conditions and †p = 0.0004, ††p < 0.0001 are used to compare basal BRET values between the mutants. b (Left) Schematic representation of the BRET-based ligand-induced Gi activation assay. (Right) CXCL12-promoted Gi activation measured by BRET in HEK293T cells transfected with HA-CXCR4, WT or mutant as indicated, Gαi1-RLucII, Gβ1, and Gγ2-GFP10. BRET400-GFP10 was measured after the addition of coel-400a (10 min) and CXCL12 (3 min). c (Left) Schematic representation of the BRET-based EPAC sensor to measure cAMP production. (Right) CXCL12-promoted EPAC inhibition was measured by BRET in HEK293T cells transfected with HA-CXCR4, WT or mutant as indicated, and RLuc-EPAC-YFP. BRET480-YFP, reporting the conformation rearrangement of the EPAC sensor from an open to a closed conformation, was measured after the addition of coel-h (10 min) and CXCL12 (5 min). b, c CXCR4 mutations predicted to stabilize the open-dimer or the closed-dimer conformation are annotated with a blue or red dimer symbol, respectively. Data shown represent the mean ± SEM of at least three independent experiments and are expressed as ΔBRET (agonist-promoted BRET).

