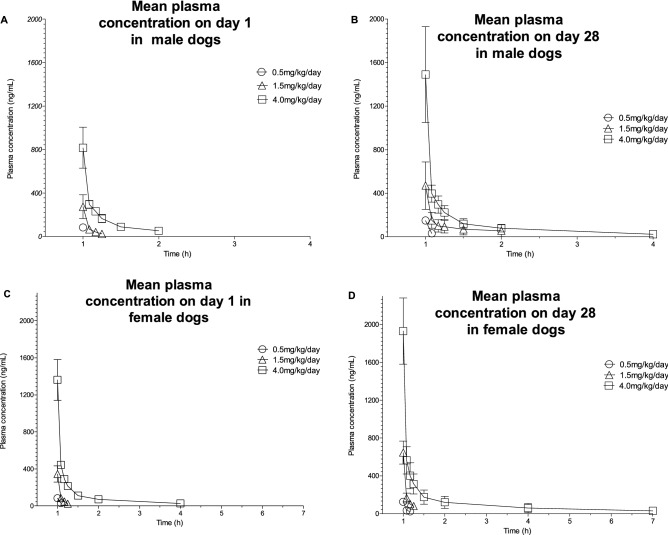
Figure 3.
Mean plasma concentrations of SET-M33 on day 1 (A) and (C) and day 28 (B) and (D) of 4 weeks of daily intravenous (infusion) administration to male (A) and (B) and female (C) and (D) dogs at 0.5, 1.5 and 4.0 mg/kg/day. Symbols (circle, triangle or square) indicate a group mean value. Bars represent standard deviations. The graphs were plotted using GraphPad Prism for Windows version 5.03, GraphPad Software, San Diego, California USA, www.graphpad.com.

