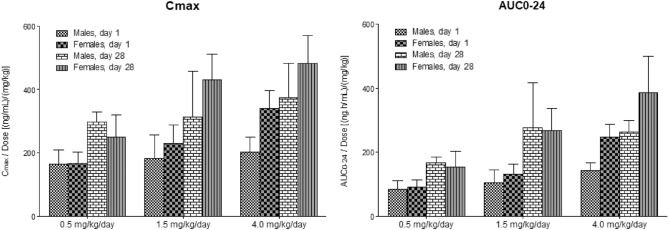
Figure 4.
Mean maximum plasma concentrations (Cmax) of SET-M33 and mean areas under the plasma concentration–time curves (AUC0-24), on day 1 and day 28 of 4 weeks of daily intravenous (infusion) administration of SET-M33 to beagle dogs at 0.5, 1.5 and 4.0 mg/kg/day. AUC0-24 area under the plasma concentration–time curve in 24-h dosing intervals, Cmax maximum plasma concentrations. Columns and bars represent group mean values and standard deviations, respectively. The graphs were plotted using GraphPad Prism for Windows version 5.03, GraphPad Software, San Diego, California USA, www.graphpad.com. Statistical analysis is not applicable to these experiments.

