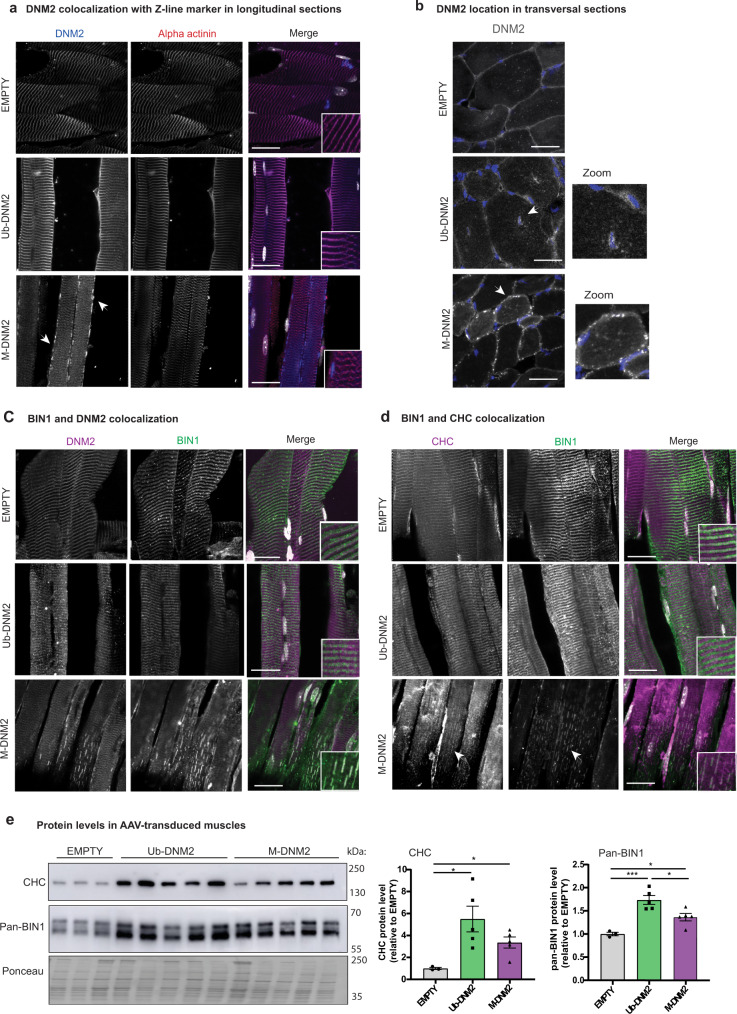
Fig. 6. M-DNM2 overexpression, but not Ub-DNM2, alters BIN1 and clathrin localization.
a TA longitudinal sections of AAV transduced muscles were stained by immunofluorescence using DNM2 and alpha actinin (marker of Z-disk) antibodies. Merge of both signals is shown at the right with nuclei in grey. b TA transversal sections of AAV transduced muscles were stained by immunofluorescence using DNM2 antibody. Nuclei is shown in blue and DNM2 signal in grey. Arrows and zoom (x2) indicate DNM2 signal accumulation around centralize nuclei with Ub-DNM2 overexpression, while M-DNM2 overexpression shows punctuate subsarcolemmal signal. c TA longitudinal sections of AAV transduced muscles were stained by immunofluorescence using DNM2 and BIN1 antibodies and (d) CHC and BIN1 antibodies. Merge of both signals is shown at the right with nuclei in grey. The arrow indicates colocalization of BIN1 and CHC in longitudinal. e Western blot using CHC and pan-BIN1 antibodies in AAV transduced muscles and quantification of protein levels compared to control condition (EMPTY) at the right (EMPTY (n = 3), Ub-DNNM2 and M-DNM2 (n = 5) mice/group; CHC analysis: Empty vs. Ub-DNM2 (*P = 0.0388) and vs. M-DNM2 (*P = 0.0190) by Brown-Forsythe and Welch ANOVA with Dunnett’s T3 post hoc test and BIN1 analysis: Empty vs. Ub-DNM2 (***P = 0.0006 and Empty) and vs. M-DNM2 (*P = 0.0458) and M-DNM2 vs. Ub-DNM2 (*P = 0.0200) by one-way ANOVA with Tukey’s post hoc test). Data are represented as mean values ± SEM. Source data are provided as a Source Data file. a–d Images displayed are projections of confocal stacks and scale bar = 20 µm. Stainings were repeated with the same result in 2 independent experiments with muscle sections from different mice.

