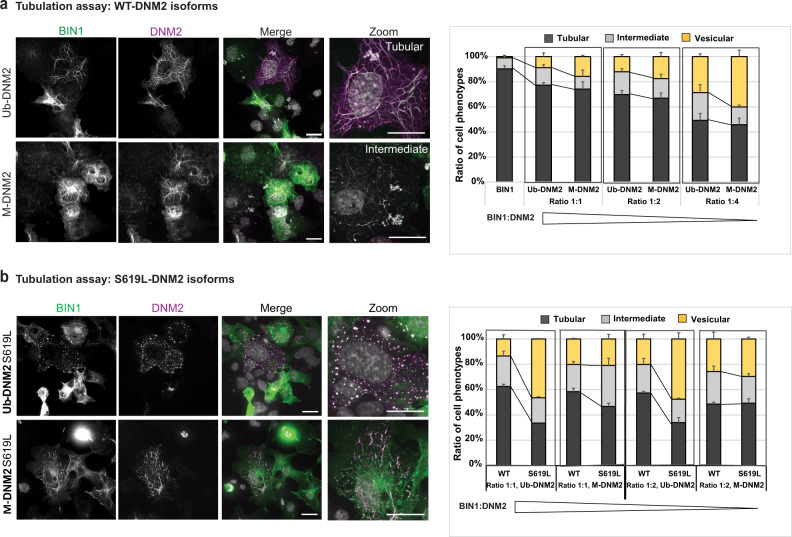
Fig. 8. Differential membrane fission activity of DNM2 isoforms.
a Fission activity in cellulo where BIN1-eGFP (green) and WT-DNM2 (magenta), M-DNM2 or Ub-DNM2, were co-expressed in COS-1 cells at incremental DNM2 concentration. Scale bar = 20 µm. b Fission activity in cellulo done as (a) co-expressing BIN1-eGFP (green) and the CNM mutant S619L-DNM2 (magenta). Scale bar = 20 µm. In both figures (a, b), percentage of each cell phenotype (tubular, intermediate or vesicular pattern) is shown at the right (average of 3 independent experiments). A representative image of the experiment at equal ratio of DNM2 and BIN1 is shown at the left. Data are represented as mean values ± SEM of a minimum of 25 cells/condition examined over 3 independent experiments. Source data are provided as a Source Data file.

