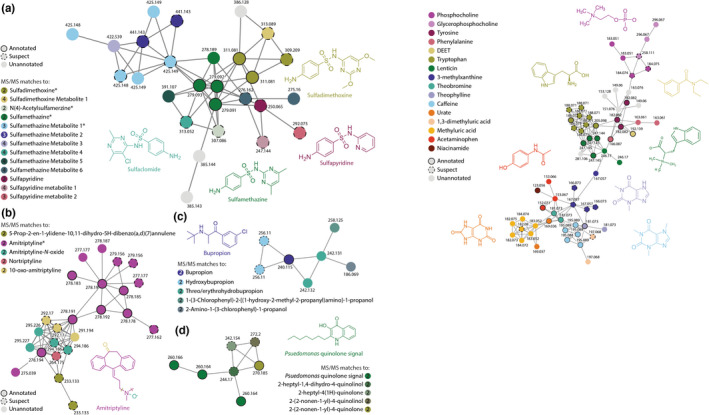
FIGURE 1.

Molecular networks containing drug and food metabolites in human milk. (a) Molecular network containing sulfonamide antibiotics and antibiotic metabolites. (b) Molecular network containing antidepressant amitriptyline and multiple known degradation products. (c) Molecular network containing the antidepressant bupropion and its metabolites. (d) Molecular network containing bacterial quorum sensor Pseudomonas quinolone signal and related metabolites. Network nodes with full annotations from the original analysis are shown with black outlines, suspect annotations are shown with dotted outlines, and unannotated nodes have no outline. Asterisks (*) mark compounds that were identified in solvent controls in at least one dataset, number in circle indicates MS/MS match level. 17 All colored nodes in these networks have been manually annotated by spectral comparison to library compounds and other related spectra. Library and spectral m/z, library quality, m/z error, and shared peaks for each MS/MS match are included in Table S2. MS/MS, tandem mass spectrometry.
