
FIGURE 1.
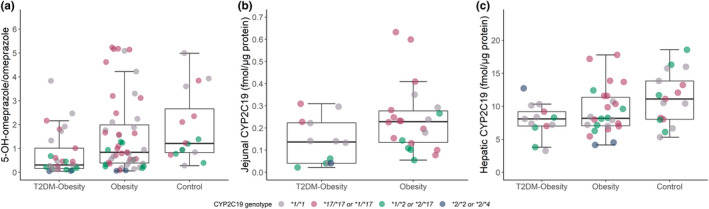
In vivo CYP2C19 activity and jejunal and hepatic protein expression in paired samples. Boxplot with individual points of (a) the 5‐OH‐omeprazole/omeprazole ratio (in vivo CYP2C19 activity), (b) jejunal CYP2C19 concentration, and (c) hepatic CYP2C19 concentration. The dots are colored according to genotype. CYP, cytochrome P450; T2DM, type 2 diabetes mellitus. Jejunal CYP2C19 concentration was only available in 34 patients subjected to Roux‐en‐Y‐gastric bypass (RYGB). Hepatic CYP2C19 concentration was only available in 56 patients subjected to RYGB or cholecystectomy.