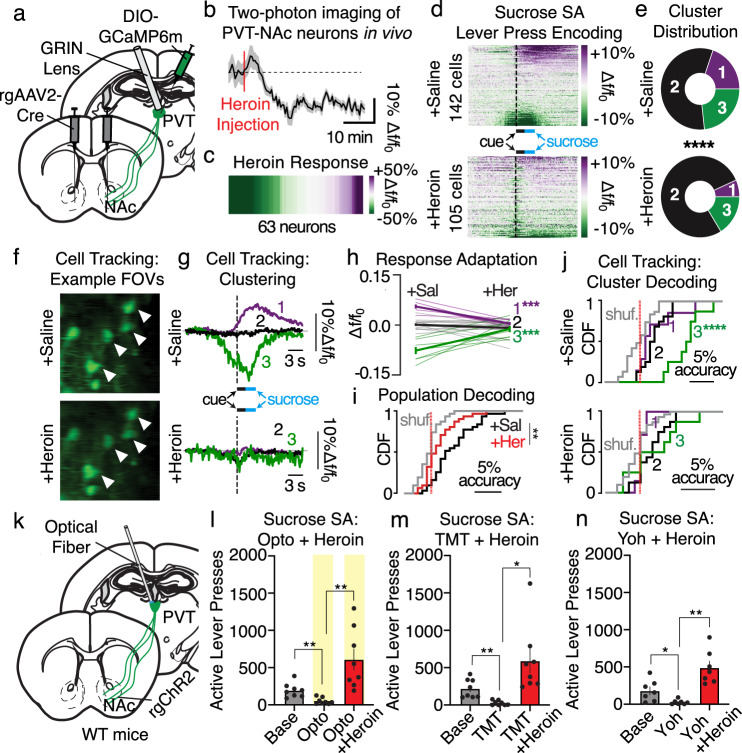
Fig. 4. PVT→NAc-dependent suppression of reward seeking is disrupted by an injection of heroin.
a Surgery for in vivo two-photon imaging. b, c Averaged trace (b) and heatmap (c) from two-photon imaging reveal that heroin reduced PVT→NAc neuronal activity (n = 63 neurons/3 mice; two-tailed t-test, t62 = 3.03, P = 0.004). d Heatmaps for all neurons during sucrose self-administration following injection of saline (top; n = 142 cells/4 mice) or heroin (bottom; n = 105 cells/4 mice). e Heroin reduced the proportion of cells in excited and inhibited ensembles (Chi-squared, χ2 = 23.5, P < 0.001). f Example FOVs for PVT→NAc neurons tracked across sucrose self-administration days (n = 4 mice, 31 tracked cells; top: saline, bottom: heroin). g Clustering of tracked cells revealed a change in ensemble dynamics for excitatory responders (7 cells), non-responders (16 cells), and inhibitory responders (8 cells). h Response amplitudes for tracked cells reveal significant response adaptations in ensemble 1 and 3, but not 2, due to heroin injection (two-way ANOVA, ensemble × time: F2,56 = 29.21; P < 0.001; Sidak’s post-hoc: ensembles 1, 3 P-values = 0.001). i Heroin reduced active lever press decoding by PVT→NAc cells (two-way ANOVA, drug × shuffling: F1,120 = 7.15, P = 0.01; Sidak’s post-hoc: Saline vs. Heroin P = 0.002). j Cluster decoding of tracked cells shows that the inhibitory ensemble best predicts an active lever during the saline test (top; two-way ANOVA, ensemble × shuffling interaction: F2,56 = 7.00, P = 0.002; Sidak’s post-hoc: P < 0.001), but none of the ensembles can predict an active lever press during the heroin test (bottom; interaction: two-way ANOVA, F2,56 = 0.75, P > 0.48). k Surgical strategy for optogenetic manipulation. l–n Heroin prevented the suppression of sucrose self-administration caused by PVT→NAc stimulation (l), TMT (m), and yohimbine (n) (Opto: n = 8 mice/group; one-way ANOVA, F2,21 = 11.56, P = 0.004; planned two-tailed t-tests: base vs. opto P < 0.01, opto vs. heroin + opto P < 0.01; TMT: n = 8 mice/group; one-way ANOVA, F2,21 = 8.77, P = 0.002; planned two-tailed t-tests: base vs. TMT P < 0.01, TMT vs. heroin + TMT P < 0.05; yohimbine: n = 7 mice/group; one-way ANOVA, F2,18 = 16.36, P < 0.001; planned two-tailed t-tests: base vs. yohimbine P < 0.05, yohimbine vs. heroin + yohimbine P < 0.01). FOV field of view, SAL saline, HER heroin, Base Baseline, Opto optogenetics, Yoh Yohimbine. Group comparisons: *P < 0.05, **P < 0.01, ***P = 0.001, ****P < 0.001. Bar and line graphs are presented as mean values ± SEM. Source data are provided as a Source Data file.

