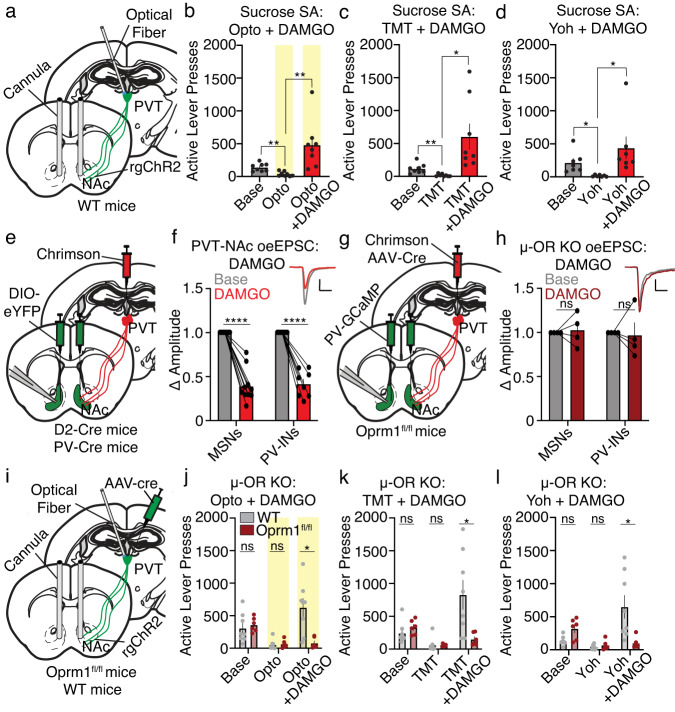
Fig. 6. PVT→NAc-dependent suppression of reward seeking is gated by presynaptic µ-opioid receptors.
a Surgical strategy for optogenetic manipulation of PVT→NAc neurons and intra-NAc DAMGO infusions. b–d Intra-NAc infusion of DAMGO prevented the suppression of sucrose self-administration caused by PVT→NAc stimulation (b), TMT (c), and yohimbine (d) (Opto: n = 8 mice/group; one-way ANOVA, F2,21 = 9.33, P = 0.001; planned two-tailed t-tests: base vs. opto P < 0.01, opto vs. DAMGO + opto P < 0.01; TMT: n = 8 mice/group; one-way ANOVA, F2,21 = 8.02, P = 0.003; planned t-tests: base vs. TMT P < 0.01, TMT vs. DAMGO + TMT P = 0.02; yohimbine: n = 7 mice/group; one-way ANOVA, F2,18 = 4.26, P = 0.03; planned t-tests: base vs. yohimbine P = 0.02, yohimbine vs. DAMGO + yohimbine P < 0.05). e Surgical strategy for patch-clamp electrophysiology. f Example electrophysiological waveforms (scale: 50pA/50 ms) and grouped data reveal that DAMGO reduced PVT→NAcMSN and PVT→NAcPV-IN oeEPSC amplitudes (MSNs: n = 10 cells, 6 mice; PV-INs: n = 8 cells, 5 mice; repeated-measures two-way ANOVA, effect of DAMGO: F1,16 = 210.9, P < 0.0001; Sidak’s post-hoc: P-values < 0.001). g Surgical strategy for knockout of PVT µ-ORs with patch-clamp electrophysiology. h Example electrophysiological waveforms (scale: 50pA/50 ms) and grouped data reveal that PVT µ-OR knockout prevented the DAMGO-induced decrease in PVT→NAcMSN and PVT→NAcPV-IN oeEPSC amplitudes (n = 4 cells per group, 2 mice; repeated-measures two-way ANOVA, effect of DAMGO F1,6 = 0.0001 P = 0.99). i Surgical strategy for PVT µ-OR knockout with simultaneous optogenetic manipulation of PVT→NAc neurons and intra-NAc DAMGO infusions. j–l Knockout of PVT µ-ORs in Oprm1fl/fl mice rescued the suppression of sucrose self-administration caused by optogenetic stimulation of PVT→NAc neurons (j), TMT (k), and yohimbine (l) despite intra-NAc DAMGO infusions (Opto: n = 6 Oprm1fl/fl, 8 WT mice; repeated-measures two-way ANOVA, day × group interaction: F2,24 = 9.74, P = 0.001; Sidak’s post-hoc: opto + DAMGO P = 0.02; TMT: n = 6 Oprm1fl/fl, 8 WT mice; repeated-measures two-way ANOVA, day × group interaction: F2,24 = 7.04, P = 0.004; Sidak’s post-hoc: TMT + DAMGO P < 0.001; yohimbine: n = 6 Oprm1fl/fl, 8 WT mice; repeated-measures two-way ANOVA, day × group interaction: F2,24 = 10.97, P = 0.0004; Sidak’s post-hoc: yohimbine + DAMGO P < 0.05). µ-OR µ-opioid receptor, Base Baseline, Opto optogenetics, Yoh Yohimbine, KO knockout; Group comparisons: *P < 0.05, **P < 0.01, ****P < 0.001. Bar graphs are presented as mean values ± SEM. Source data are provided as a Source Data file.

