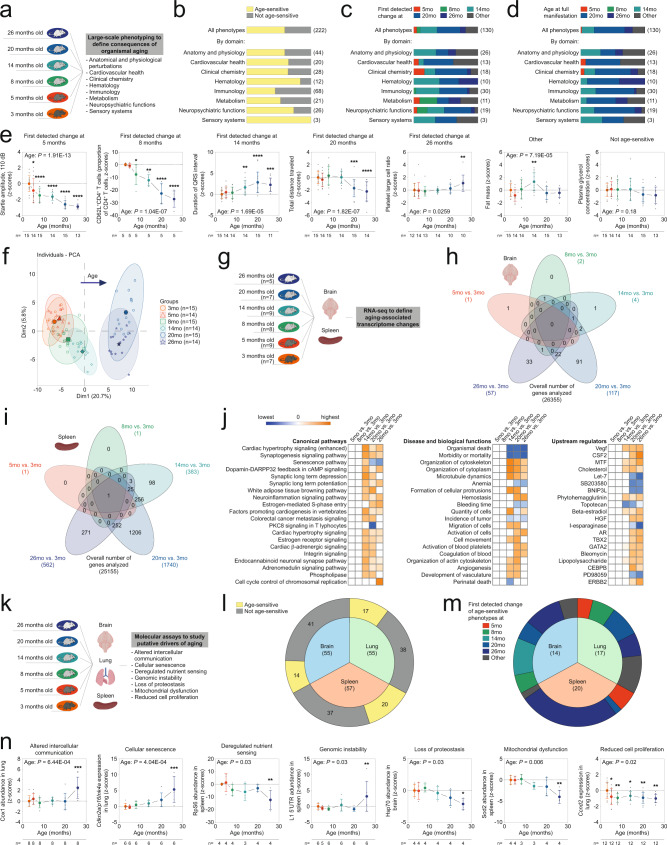
Fig. 2. Multidimensional analyses of age-dependent phenotypic change in C57BL/6J mice.
a–f Deep phenotyping results in wildtype C57BL/6J mice. a Schematic illustration of deep phenotyping study design. Mouse symbols adapted from ref. 10. b Relative proportion of ASPs among all phenotypes examined. Age at first detectable change (c) and age at full manifestation (d) of ASPs shown as proportion of all ASPs. e Representative examples of ASPs with various ages at first detectable phenotypic change. Data was analyzed using one-way ANOVA with the between-subjects factor age followed by Fisher’s LSD posthoc analyses, where appropriate. f Principal component analysis of deep phenotyping data. g–j Summary of RNA-seq data. g Schematic illustration of RNA-seq study design. Venn diagram shows, for brain (h) and spleen (i), the number of differentially expressed genes (FDR < 0.05) relative to the 3-month old reference group together with the intersection of the corresponding gene sets. j Ingenuity Pathway Analysis shows top canonical pathways, diseases and biological functions as well as predicted upstream regulators of genes differentially expressed in spleen relative to the 3-month old group. Positive z-scores (orange) indicate activating effects, negative z-scores (blue) indicate inhibitory effects on corresponding processes. Pathway analyses of brain data are shown in Supplementary Fig. 3. k–n Summary of molecular analyses designed to study putative driver mechanisms of aging in spleen, lung and brain. k Schematic illustration of study design (for sample size, see Supplementary Data 6). l Proportion of age-sensitive molecular parameters obtained. m Proportion of the different age-at-first-detectable-change categories among all age-sensitive molecular markers in individual tissues. n Representative examples of molecular markers covering the different hallmarks of aging. Line plots (e, n) show means +/− S.D. (individual data points are superimposed; we did not use jittering to separate data points with identical values). Data was analyzed using one-way ANOVA with the between-subjects factor age followed by Fisher’s LSD posthoc analyses, where appropriate. *p < 0.05, **p < 0.01, ***p < 0.001, ****p < 0.0001 relative to 3-month young adult reference group. Sample sizes in each group and experiment are provided within the figure. Source data are provided in Source Data file. Created with BioRender.com.

