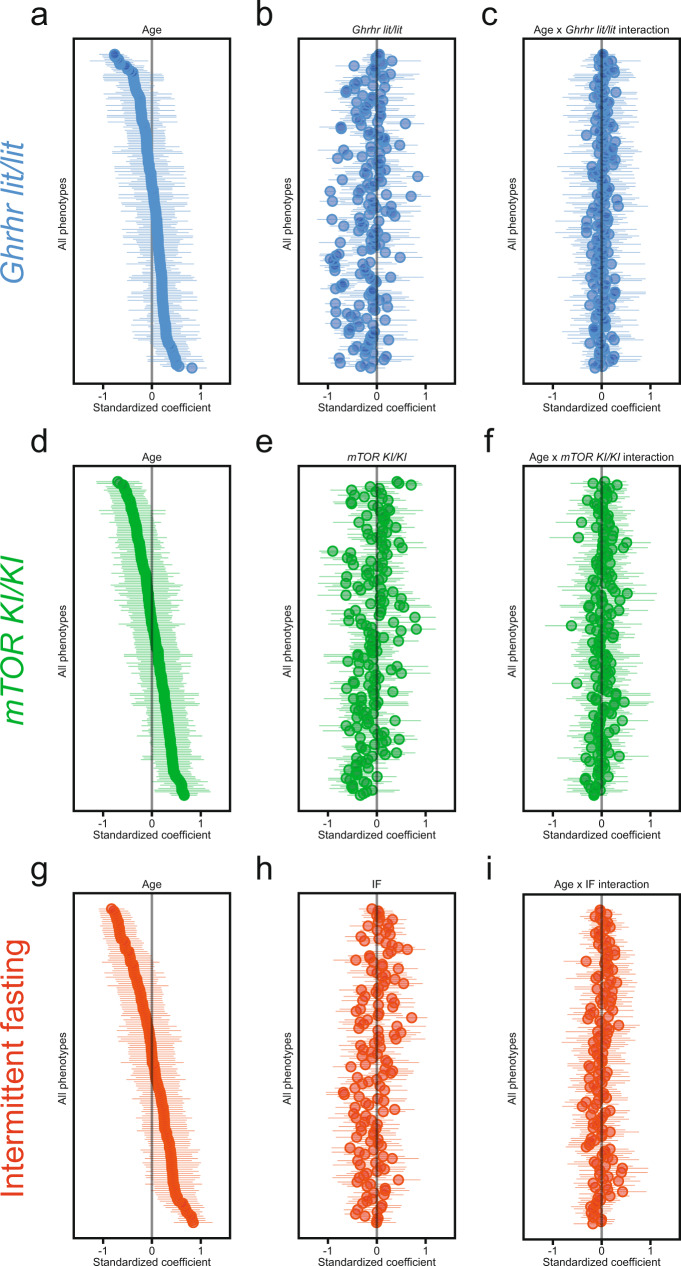
Fig. 4. PAAIs – standardized coefficients with 95% confidence intervals for age, intervention and intervention × age interaction terms.
Phenotypes analyzed within the Ghrhrlit/lit, mTORKI/KI and IF cohorts are denoted in blue, green and red, respectively. The forest plots show, for all three PAAIs examined in the present paper, standardized coefficients, with 95% confidence intervals, corresponding to the age effects (a, d, g), intervention effects (b, e, h) and intervention × age interactions (c, f, i) derived from linear models applied to all continuously distributed phenotypes included in the present study. Note that we have not included phenotype labels on the y-axes to allow for a compact data presentation. Phenotypes were sorted based on the coefficient of the age effect. For a given intervention, this order is preserved across all panels from left to right (showing age effects, intervention effects and intervention × age interactions) to permit comparison of coefficients across any given phenotype. Sample sizes (number of mice per group) underlying these analyses are detailed, for each phenotype and all PAAIs, in Supplementary Data 8, 10 and 13.

