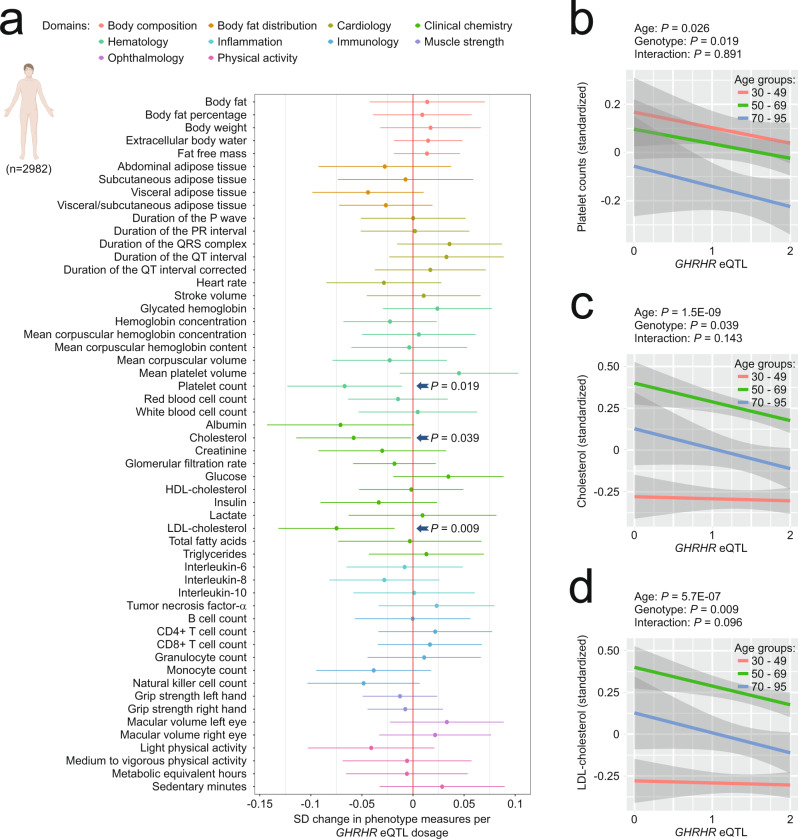
Fig. 5. GHRHR eQTL effects on aging-associated phenotypes in humans.
a–d Phenotyping results in a large deep-phenotyped human cohort that included participants of both genders with an age range from 30–95 years. a Change in phenotype (in standard deviations (SD) from the mean) associated with GHRHR eQTL dosage with the horizontal whiskers indicating the 95% confidence intervals of the mean effect estimate; * denotes p < 0.05 for the linear association between GHRHR eQTL dosage and phenotype The association between eQTL dosage and each phenotypic measure was assessed using multiple linear regression models adjusted for age, sex and population stratification using the first ten genetic principal components. Our analyses are based on unadjusted p-values. Change of platelet count (b), total cholesterol (c) and LDL-cholesterol (d) associated with GHRHR eQTL dosage in 30–49 years old (red line), 50–69 years old (green line) and 70–95 years old humans (blue line); the lines represent the best-fit least squares regression lines with surrounding 95% confidence intervals of the mean indicated in gray. The eQTL dosage was coded as GG = 0, AG = 1, and AA = 2 (GG is associated with lowest expression levels, AA with highest; see Supplementary Fig. 8a). Sample size was 994 human participants per age group. Created with BioRender.com.

