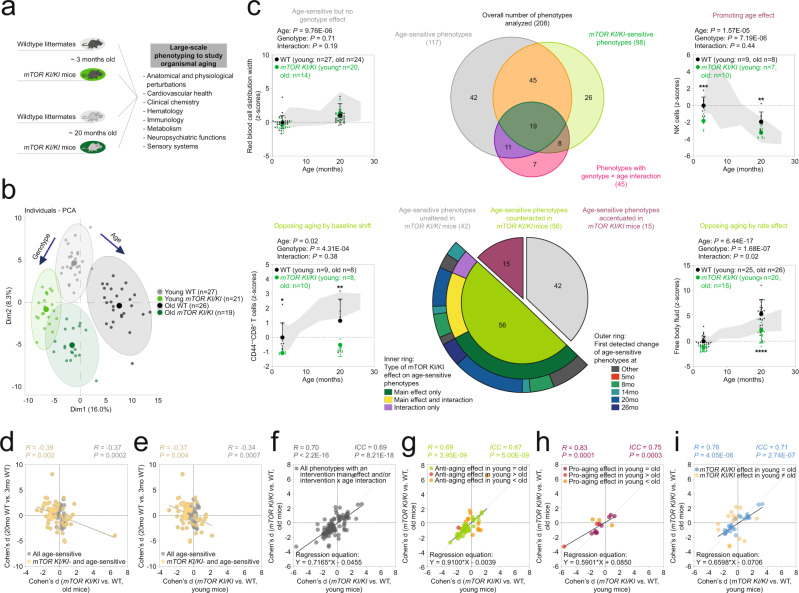
Fig. 6. A hypomorphic mTOR mutant allele attenuated ASPs via a mixture of age-independent effects and effects more pronounced in old mice.
a–i Deep phenotyping results in mTORKI/KI mice. a Schematic illustration of study design. Mouse symbols adapted from ref. 10. b Principal component analysis of deep phenotyping data. c Venn diagram shows the number of ASPs, genotype-sensitive phenotypes, phenotypes with a genotype × age interaction and their intersection. Sunburst chart shows the number of ASPs either unaltered, counteracted or accentuated by genotype. For ASPs counteracted by genotype, the inner ring shows the proportion of phenotypes with either a genotype main effect, a genotype × age interaction or both. The outer ring shows when changes in the corresponding ASPs were first detected in our baseline study. Line charts show representative examples of phenotypes influenced by age and/or intervention in the different possible ways. Data are presented as z-scores (normalized to the young WT group) and are plotted as mean +/− S.D. (individual data points are superimposed). Two-way ANOVAs with the between-subjects factors age and genotype followed by Fisher’s LSD posthoc analyses, where appropriate, were used for data analysis. *p < 0.05, **p < 0.01, ***p < 0.001 relative to age-matched wildtype littermate controls. Life-time trajectories of the corresponding phenotypes, representing measurements obtained in our baseline study, are shown by the gray-shaded area in the background (bounded by mean +/− S.D.). Effect size of genotype in old (d) or young (e) mice plotted vs. the effect size of age for all ASPs and those intersecting with genotype (via a main effect and/or interaction), respectively. f–i Effect size of genotype in young mice plotted vs. the effect size in old mice for different sets of phenotypes: g ASPs ameliorated by genotype via a main effect and/or an interaction. h ASPs accentuated by genotype. i Phenotypes featuring a genotype main effect and/or a genotype × age interaction but no effect of age. f All phenotypes shown in g–i. ICC = intraclass correlation. Statistical effect size comparisons were performed via two-sided z-tests. Our analyses are based on unadjusted p-values. Source data are provided as a Source Data file.

