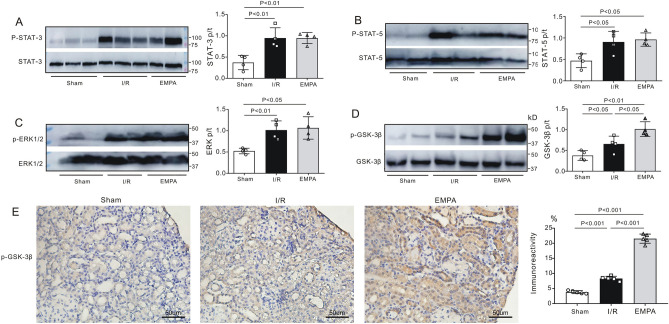
Figure 6.
The effect of empagliflozin on renal GSK-3β phosphorylation post-I/R. (A–D) Left, Representative western blots of renal p-STAT-3 and t-STAT-3 (A), p-STAT-5 and t-STAT-5 (B), p-ERK1/2 and t-ERK1/2 (C), and p-GSK-3β and t-GSK-3β (D) after I/R injury. Sham sham-operated, I/R ischemia/reperfusion, EMPA empagliflozin. Right, Relative abundance of protein phosphorylation levels was normalized to total protein. n = 4 per group. (E) Left, Representative images of immunostaining for p-GSK-3β in kidney sections after renal I/R injury. Scale bars, 50 μm. Right, p-GSK-3β immunoreactivity levels. Each group, n = 5. Data shown are the mean ± SD. Significant differences between groups were determined by one-way ANOVA (A–E).

