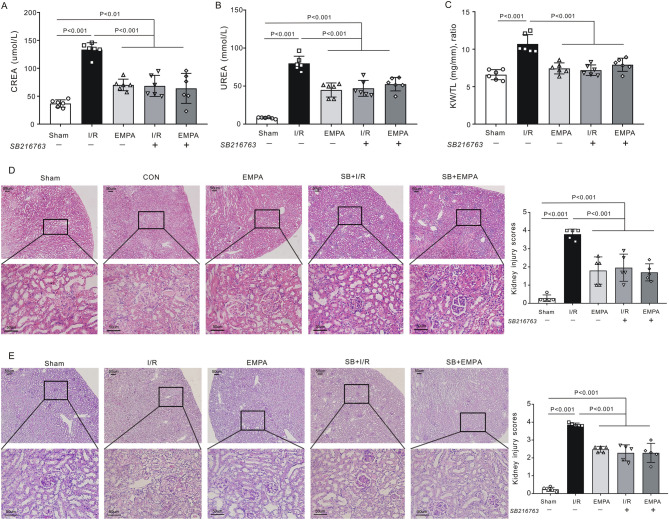
Figure 7.
Pharmacological inhibition of GSK-3β mimics empagliflozin-stimulated renal protection. (A, B) Serum levels of creatinine (CREA) (A) and urea (UREA), (B) in mice with (+) or without (−) SB216763 treatment. n = 6 per group. Sham sham-operated, I/R ischemia/reperfusion, EMPA empagliflozin. Values for sham, I/R and empagliflozin mice are repeated from Fig. 1B and C for comparison. (A) Kidney weight-to-tibia length (KW/TL) ratio of the mice with (+) or without (−) SB216763. n = 6 per group. Values for sham, I/R and empagliflozin mice are repeated from Fig. 1D for comparison. (D–E) Left, Representative images of kidney sections stained with H&E (D) or PAS (E) in the presence (+) or absence (−) of SB216763 after renal I/R. n = 5 mice per group. Sham: sham-operated, I/R: ischemia/reperfusion. EMPA empagliflozin. Scale bars, 50 μm. Right panel, renal damage scores in each group. Values for sham, I/R and empagliflozin mice are repeated from Fig. 2A and B for comparison. Data shown are the mean ± SD. Significant differences between groups were determined by one-way ANOVA (A–E).

