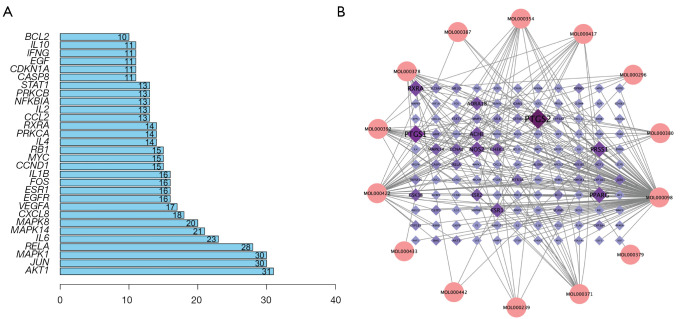
Figure 3.
Candidate genes and connection with active ingredients. (A) Bar plot of connections between proteins encoded by candidate genes. The x-axis represents the number of neighboring proteins of the target protein. The y-axis represents the target protein. (B) Active compound and candidate gene network. The sizes and colors of the nodes are illustrated from big to small and dark purple to light purple in descending order of degree values.

