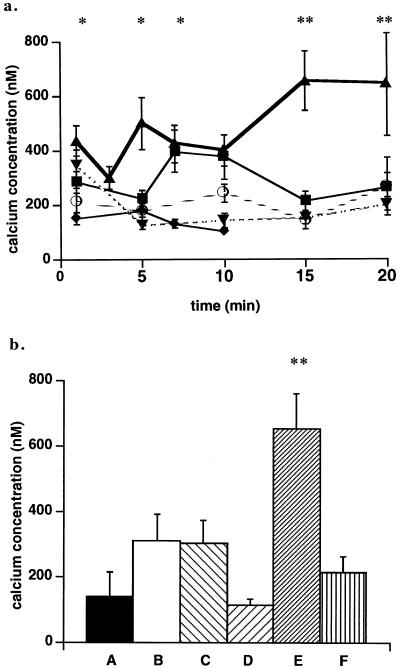
FIG. 4.
Effects of SK&F 96365 and thapsigargin on calcium signaling in J774 cells after infection with wild-type or mutant L. monocytogenes. (a) J774 cells were loaded with fluo 3 and SNARF-1 as described in the text. Changes in cytosolic calcium levels were measured at intervals for 20 min in uninfected cells (○), wild-type infected control cells (▴), and in wild-type-infected cells treated with 10 μM SK&F 96365 (■), 25 μM SK&F 96365 (⧫), or 1 μM thapsigargin (▾). Calcium levels in uninfected inhibitor-treated cells did not differ from those seen in uninfected untreated cells. These data represent the mean ± standard error of three to five cell preparations. ∗, P < 0.05 by Student’s t test for calcium levels measured at 1 and 5 min in cells infected with wild-type L. monocytogenes compared to those in uninfected cells and in infected cells pretreated with 10 and 25 μM SK&F 96365 at 1 and 5 min or thapsigargin at 5 min. At 7 and 10 min, P < 0.05 when calcium levels in infected cells pretreated with 25 μM SK&F 96365 or thapsigargin were compared to those in untreated infected cells. ∗∗, P < 0.01 by Student’s t test for calcium levels at 15 and 20 min in untreated infected cells compared to those in infected cells pretreated with 10 μM SK&F 96365 or thapsigargin. (b) Cytosolic calcium was measured in control or inhibitor-treated J774 cells loaded with fluo 3 and SNARF-1 and infected with wild-type or plcA (PI-PLC) mutant L. monocytogenes. Cytosolic calcium levels are given for 15 min p.i. for cells infected with or treated as follows: A, uninfected untreated cells; B, cells infected with the PI-PLC mutant; C, cells infected with the PI-PLC mutant and treated with 25 μM SK&F 96365; D, cells infected with the PI-PLC mutant and treated with 1 μM thapsigargin; E, cells infected with wild-type L. monocytogenes; and F, cells infected with wild-type L. monocytogenes and treated with 10 μM SK&F 96365. Calcium levels in uninfected inhibitor-treated cells did not differ from those seen in uninfected untreated cells. These data represent the mean ± standard error for three to five cell preparations. ∗∗, P < 0.01 by Student’s t test for calcium levels in cells infected with wild-type L. monocytogenes compared to those in infected cells treated with 10 μM SK&F 96365.

