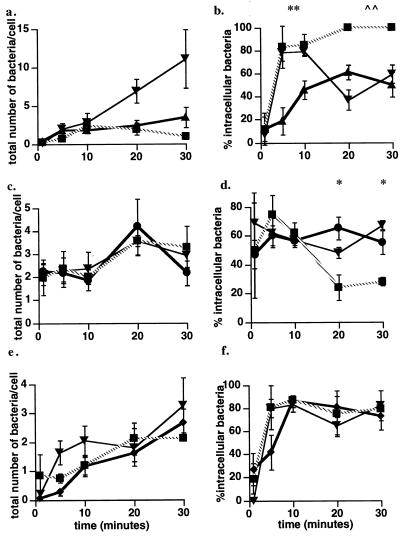
FIG. 6.
Effects of SK&F 96365 and thapsigargin on bacterial association and entry. The total number of bacteria associated with cells (extracellular plus intracellular) and the percentage of intracellular bacteria were determined as described in the text. (a, c, and e) Total number of bacteria per cell for infection with the wild type (▴) (a), the plcA (PI-PLC) mutant (●) (c), the plcB (PLC) mutant (⧫) (e). (b, d, and f) Percentage of intracellular bacteria after infection with the wild type (b), the plcA (PI-PLC) mutant (d), or the plcB (PLC) mutant (f). Within each panel, either bacterial association (a, c, and e) or entry (b, d, and f) in untreated J774 cells was compared to association and entry in cells treated with 25 μM SK&F 96365 (▾) or 1 μM thapsigargin (■). These data represent the mean ± standard error for three to five cell preparations. (b) ∗∗, P < 0.01 by Student’s t test for the percentage of intracellular wild-type bacteria in untreated J774 cells compared to the percentage of intracellular wild-type bacteria in both SK&F 96365- and thapsigargin-treated cells at 5 and 10 min. ∧∧, P < 0.01 by Student’s t test for the percentage of intracellular wild-type bacteria in untreated J774 cells compared to the percentage of intracellular wild-type bacteria in thapsigargin-treated cells at 20 and 30 min. (d) ∗, P < 0.05 by Student’s t test for the percentage of intracellular bacteria (PI-PLC mutant) in untreated J774 cells compared to the percentage of intracellular bacteria in thapsigargin-treated cells at 20 and 30 min.

