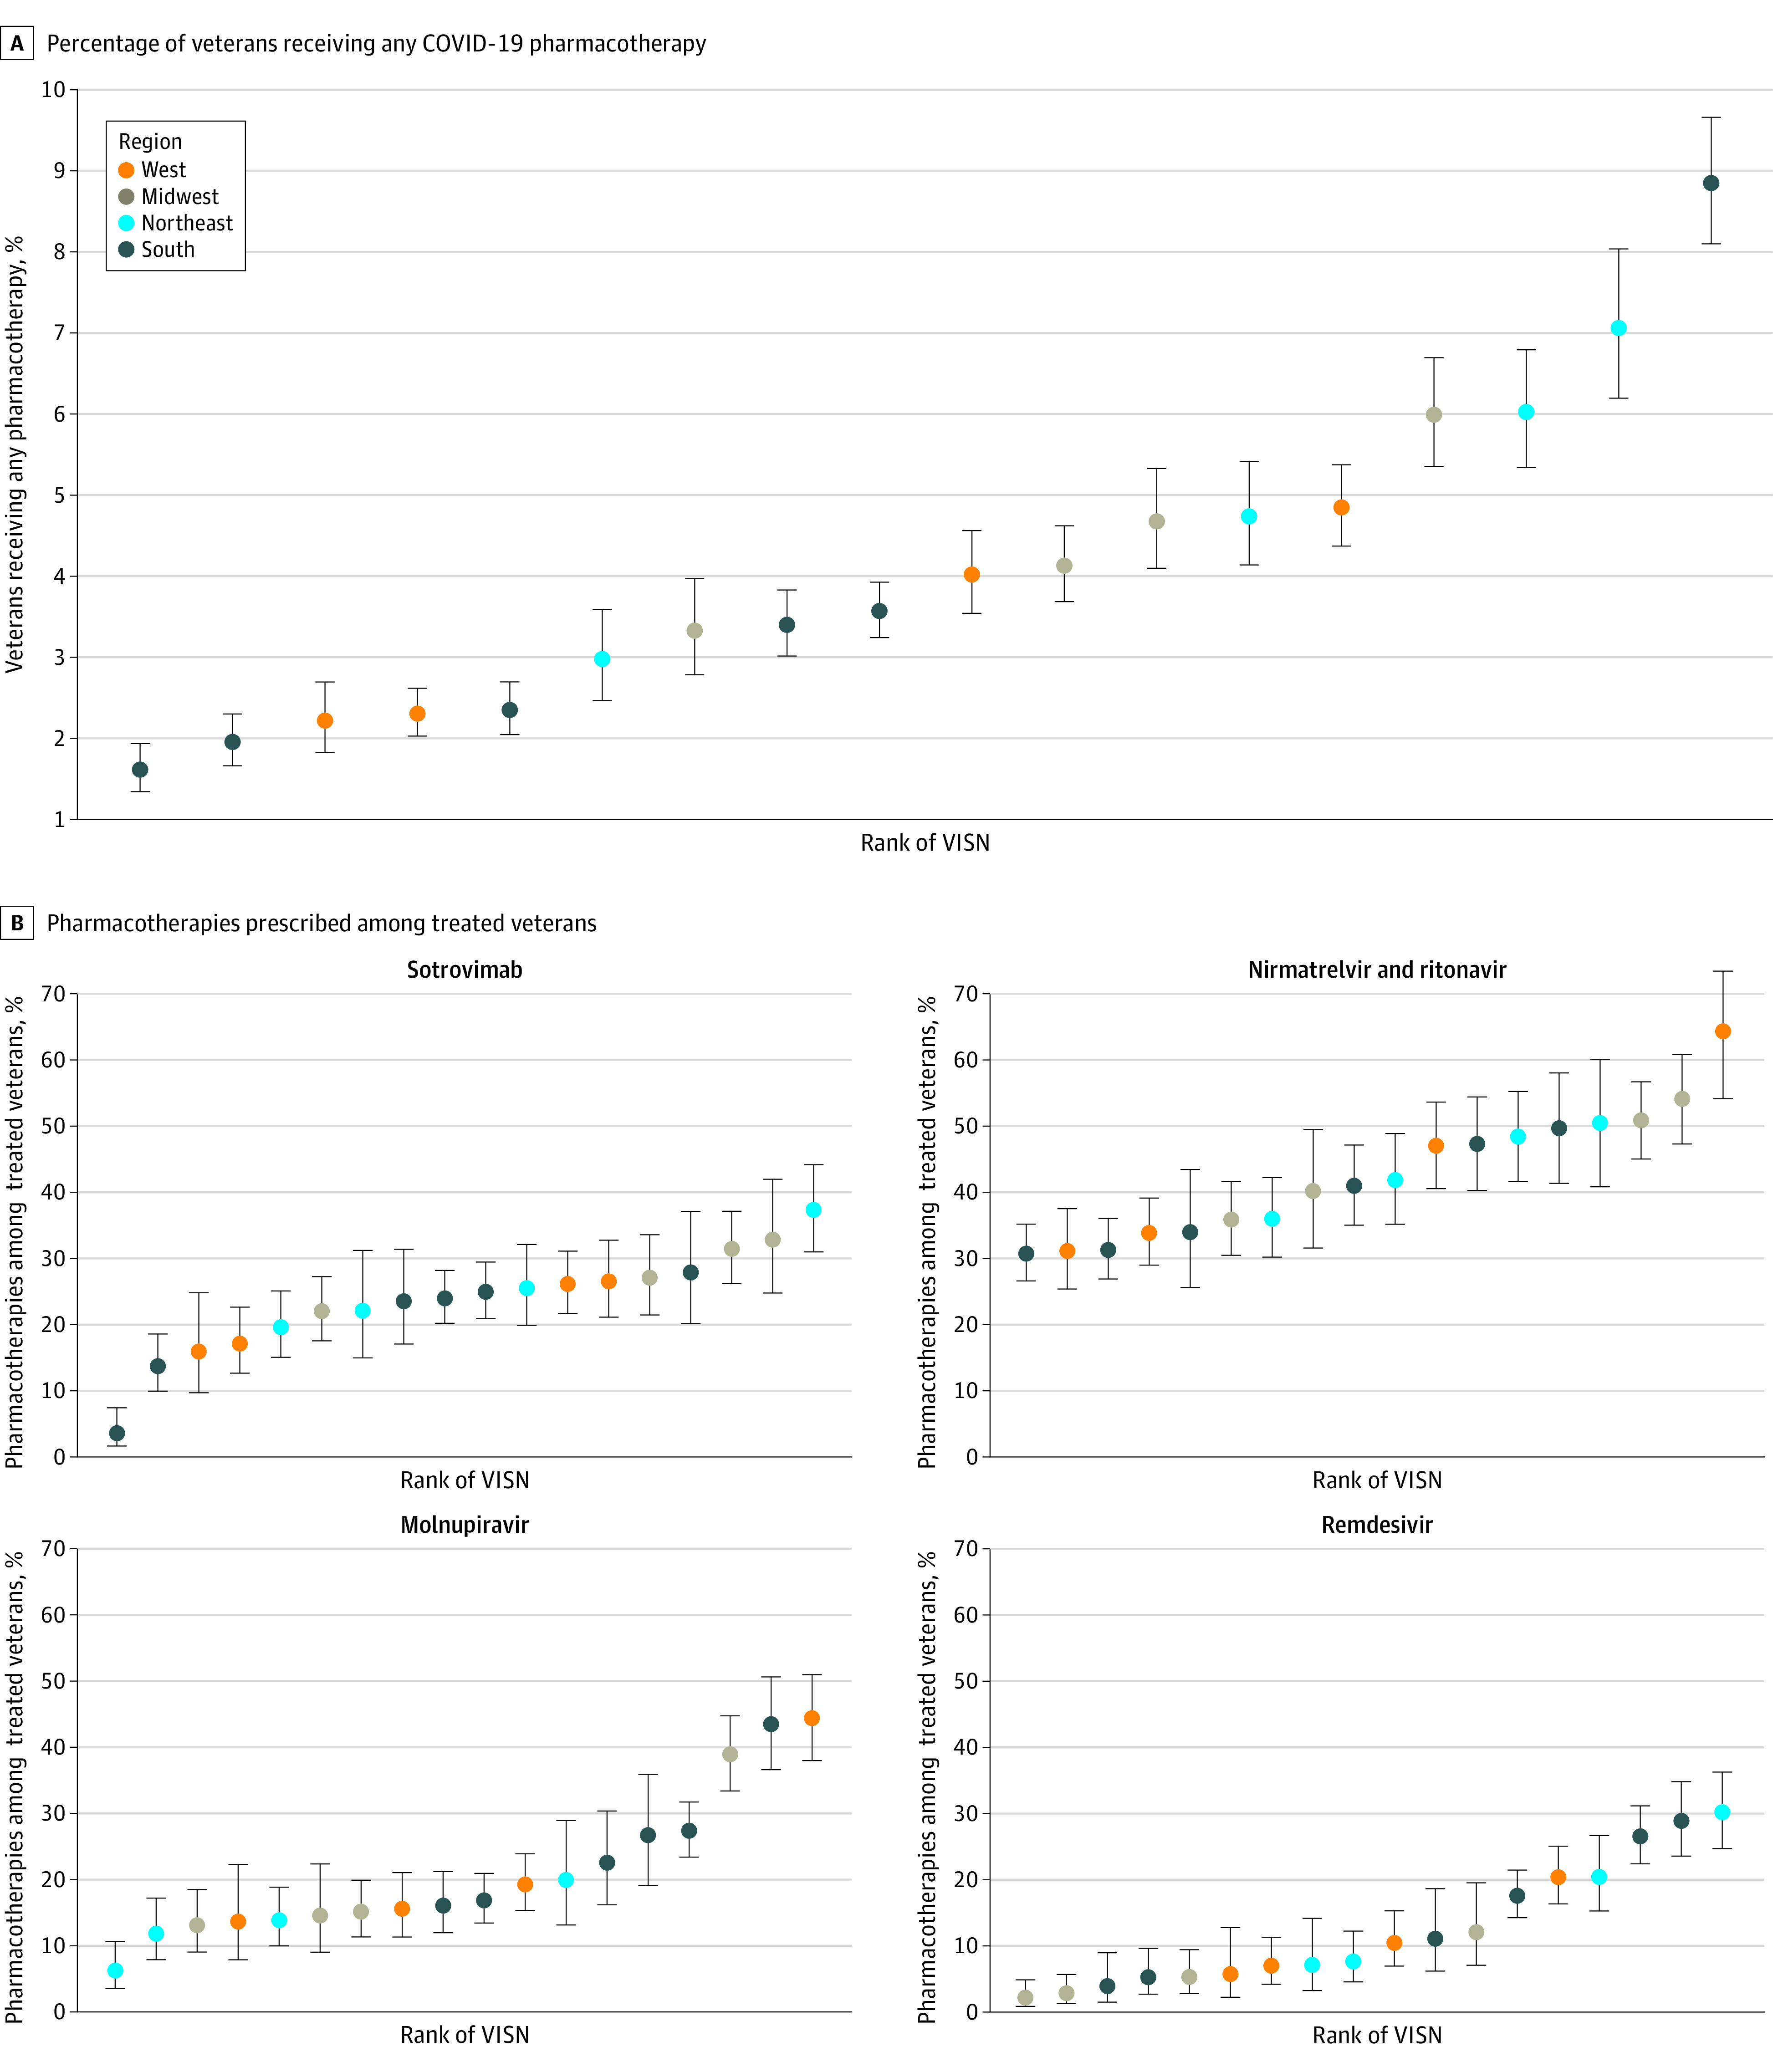
Figure 2. Distribution of COVID-19 Pharmacotherapies by Veterans Integrated Services Networks.

A, Percentage of veterans receiving any COVID-19 pharmacotherapy. B, Pharmacotherapies prescribed among treated veterans. Regions are based on VISNs. West includes VISNs 19 to 22; Midwest: 10, 12, 15, 23; Northeast: 1, 2, 4, 5; South: 6 to 9, 16, 17. Error bars indicate 95% CIs for proportions; VISN, Veterans Integrated Services Network.
