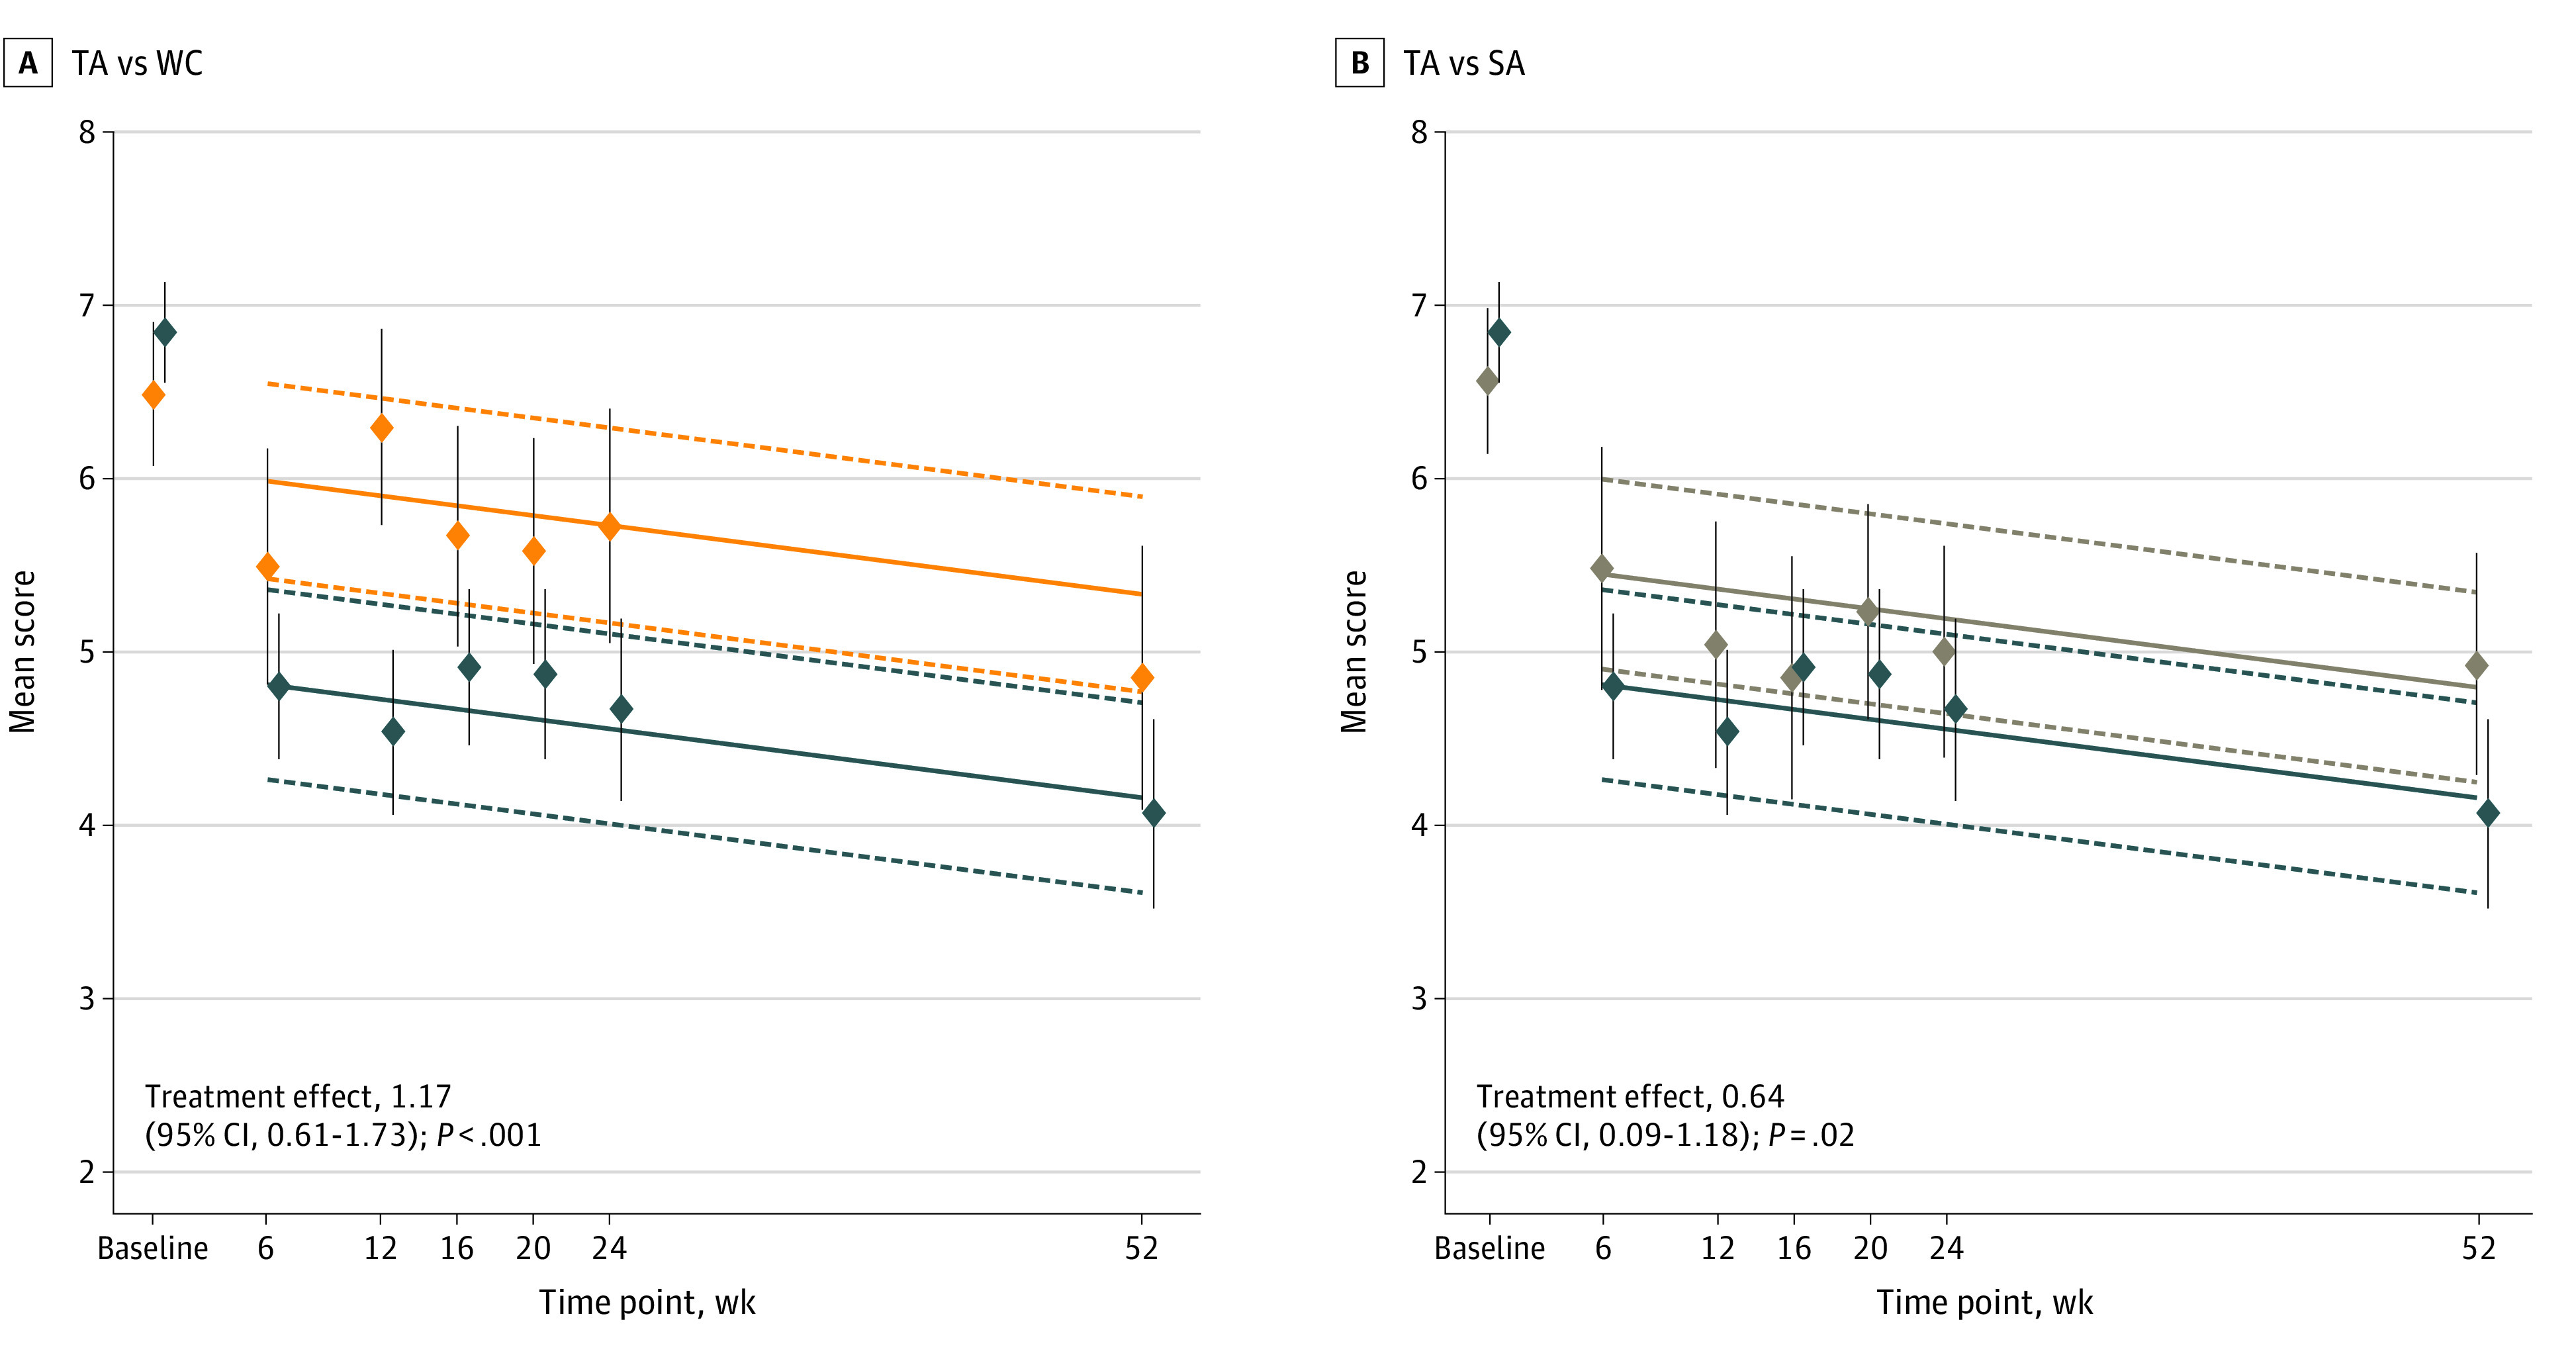
Figure 2. Mean Difference in Brief Pain Inventory Worst Pain Scores Over Time in True Acupuncture (TA) vs Waiting List Control (WC) and Separately in TA vs Sham Acupuncture (SA) .

Lower scores indicate less pain. For this analysis, linear mixed models were used. Dark blue lines indicate TA; orange lines, WC; and tan lines, SA. The dashed lines represent the lower and upper 95% CIs for the fitted lines. The diamonds indicate the mean observed BPI-WP scores at each assessment time; the vertical lines through each diamond indicate the 95% CIs for the means.
