
Figure 5.
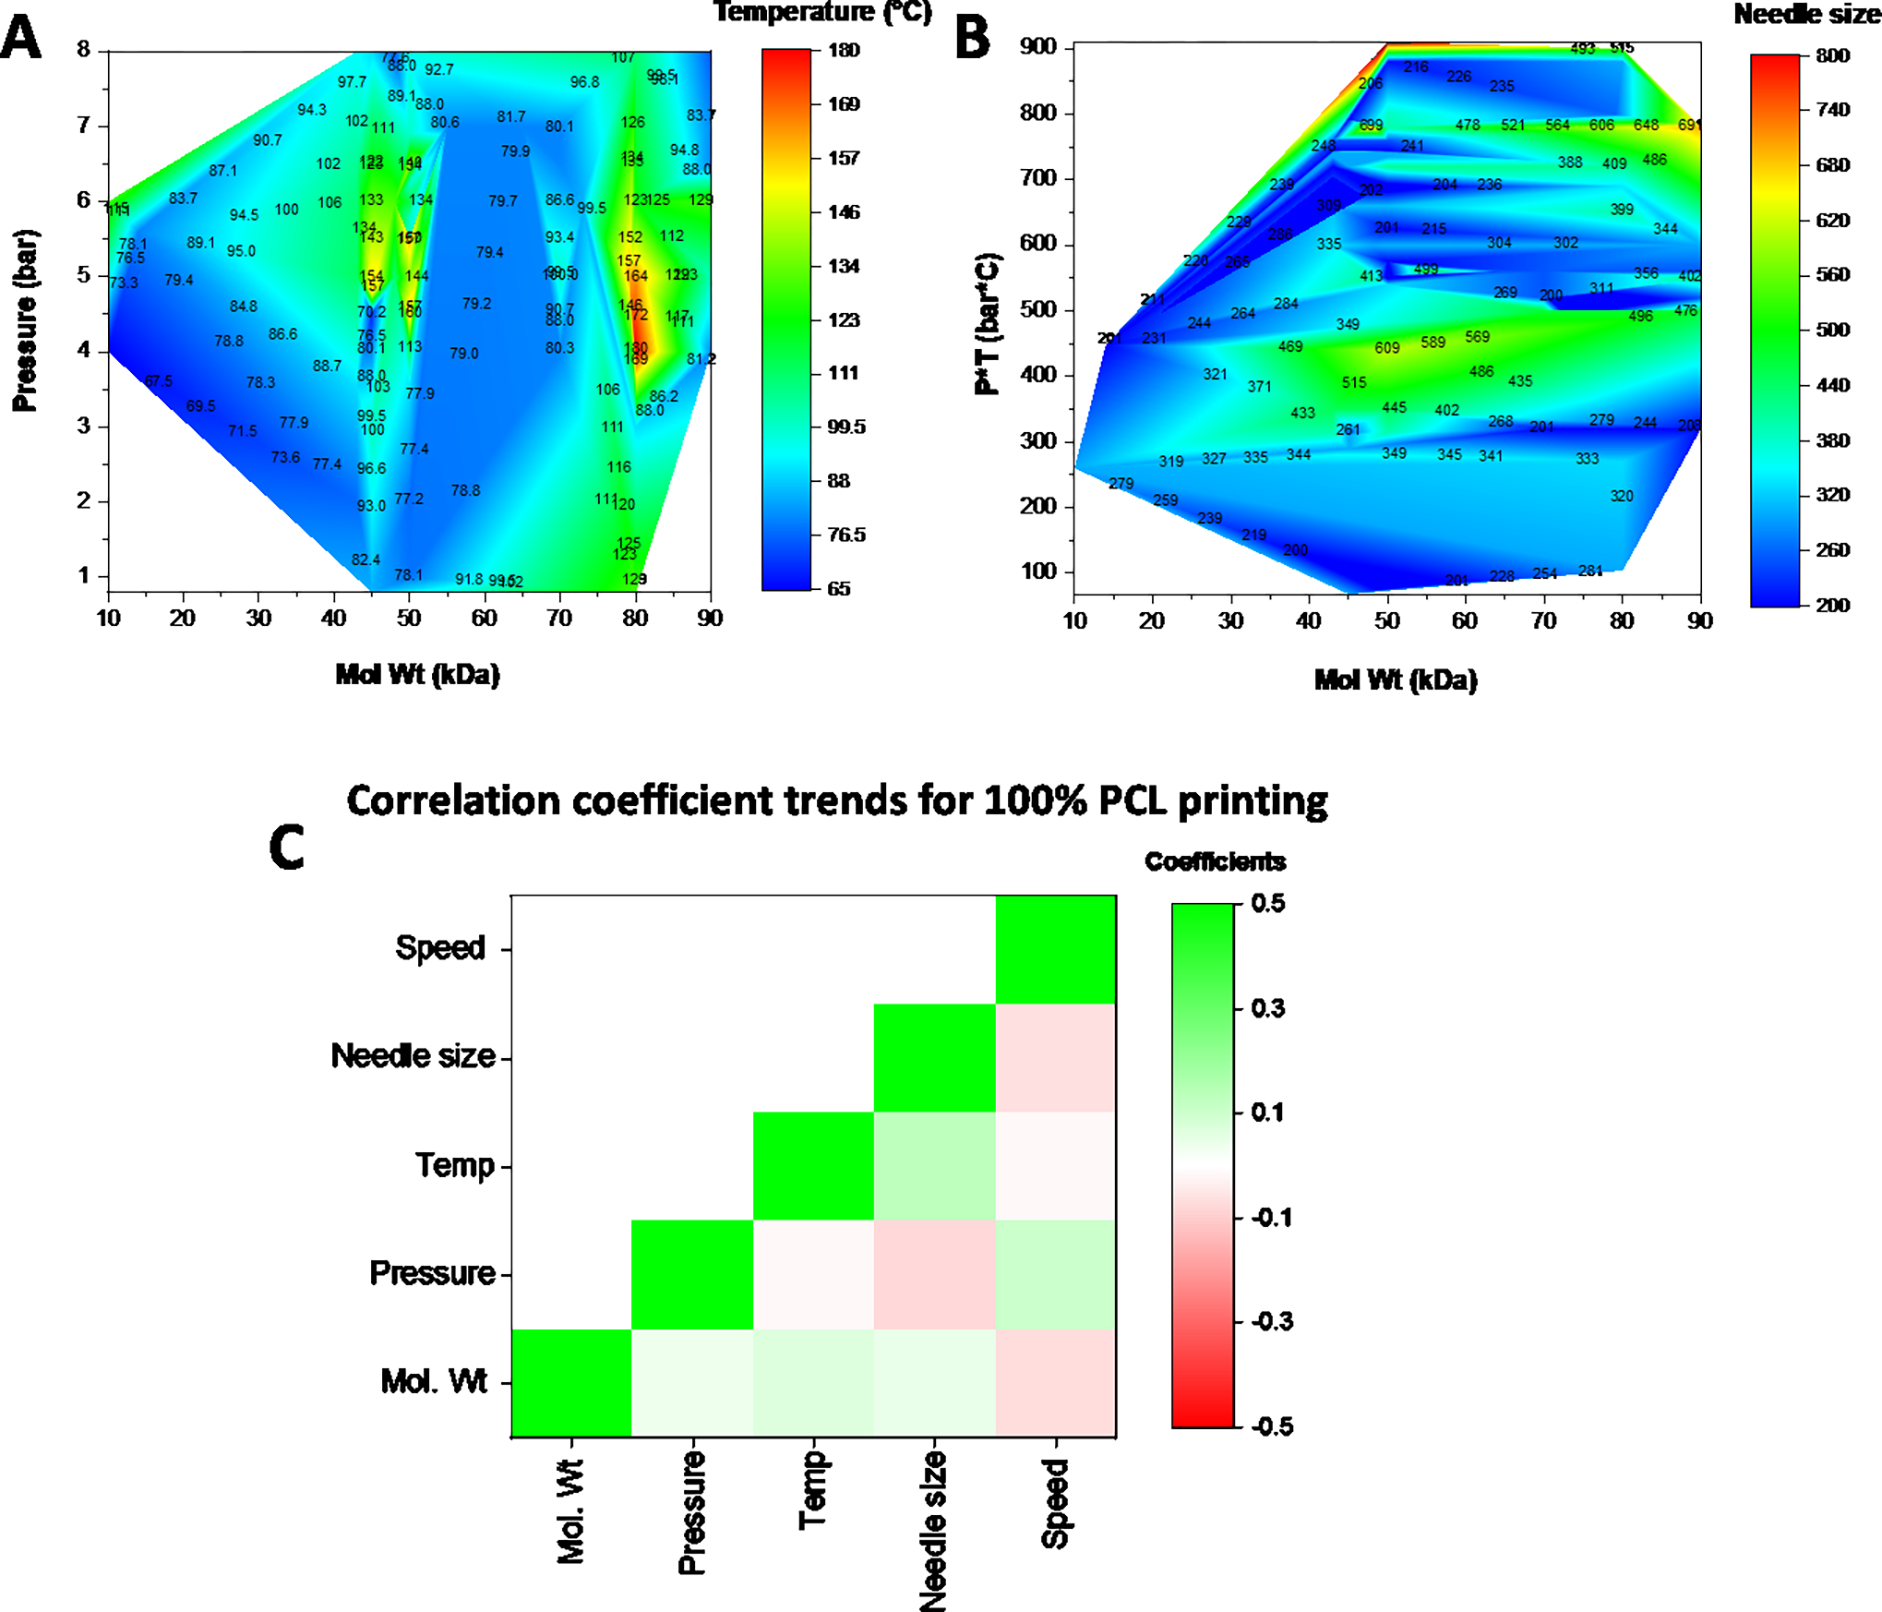
Contour heat map of the printing parameters for 100 wt% PCL at different molecular weights. (A) Impact of molecular weight on the pressure and temperature needed for extrusion. (B) Impact on needle size. (C) A heat map of the pearson correlation coefficients for each of the parameters with green showing a positive correlation and red indicating a negative correlation between the parameters. Units: Speed (mm/s); Needle size (um), Temp (C); Pressure (bar); Mol Wt (kDa)