Figure 1.
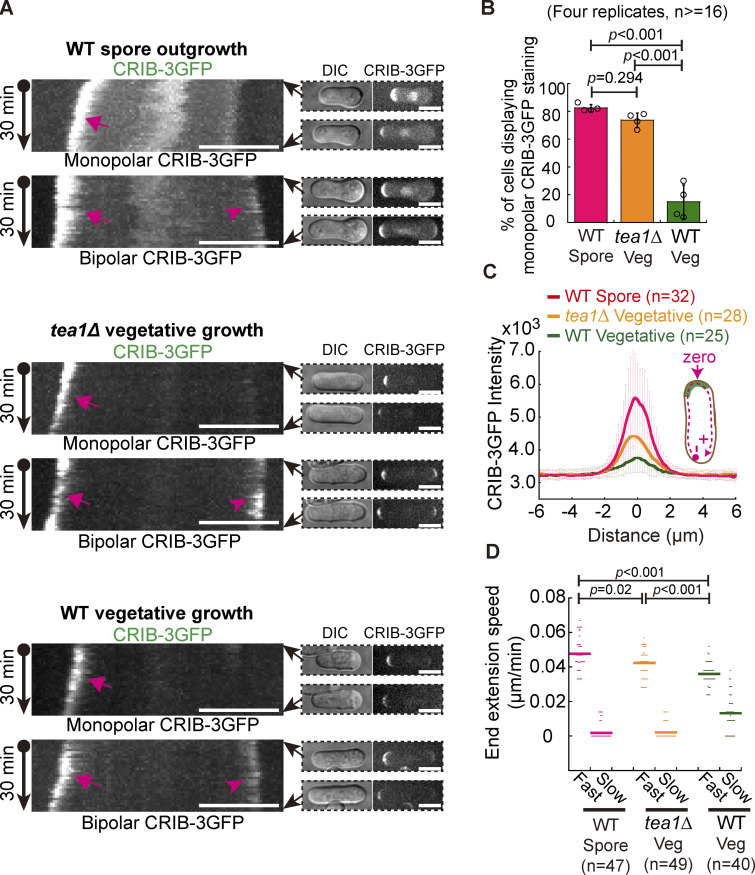
CRIB-3GFP dynamics in fission yeast WT germinating spores and WT and tea1Δ vegetative cells. (A) Maximum projection images of CRIB-3GFP (marking Cdc42-GTP) dynamics in WT germinating spores and WT and tea1-deletion (tea1Δ) vegetative cells. Movies of 30 min (1-min intervals) were acquired for the indicated cells and were used to construct kymograph graphs (shown on the left panel). Arrows and arrowheads on the kymograph graphs indicate the fast- and slow-growing ends that displayed CRIB-3GFP staining, respectively. Images at 0 and 30 min are shown on the right of the kymograph graphs. Scale bar, 10 μm. (B) Quantification of monopolar CRIB-3GFP staining in WT germinating spores and WT and tea1Δ vegetative cells. Independent experiments were repeated four times, and the number of cells analyzed for each experiment was not less than 16. One-way ANOVA with Tukey HSD post hoc test was used to calculate the P values. (C) Plot of CRIB-3GFP intensity measured along the cell contour as illustrated by the pink dashed line in the diagram. Zero indicates the geometric center of the growing end while “+” and “−” indicate the positive and negative distances on the x-axis, respectively. Thick lines and error bars are the mean ± SD. The number (n) of cells analyzed is indicated. (D) Extension speed of the fast- and slow-growing ends of the indicated cells. Bars represent the mean. The Wilcoxon-Mann-Whitney Rank Sum test was used to calculate the P values. The number (n) of cells analyzed is indicated.

