Figure 3.
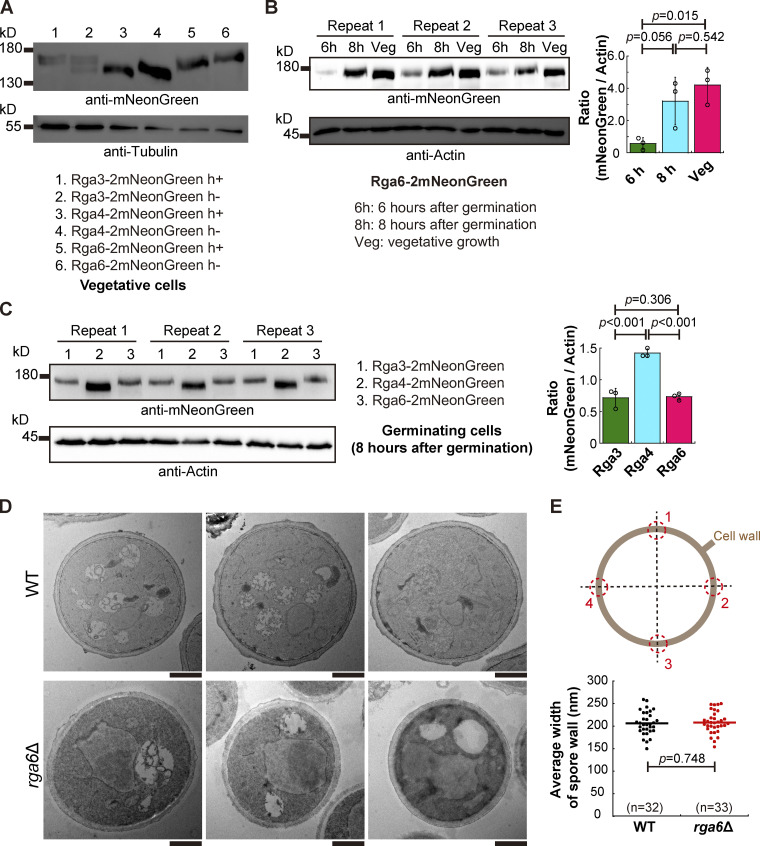
Endogenous expression of Rga3-2mNeonGreen, Rga4-2mNeonGreen, and Rga4-2mNeonGreen, and the effect of the absence of Rga6 on the spore wall. (A) Western blotting analysis of Rga3-2mNeoGreen, Rga4-2mNeoGreen, and Rga6-2mNeoGreen expressed in the indicated vegetative cells. Antibodies against mNeonGreen and Tubulin were used. (B) Western blotting analysis of Rga6-2mNeoGreen in germinating spores (6 and 8 h after germination) and in vegetative cells. Three independent experiments were carried out, and antibodies against mNeonGreen and actin were used. The ratio of the band intensity of mNeonGreen to that of Actin is shown on the right. One-way ANOVA with Tukey HSD Post Hoc test was used to calculate the P values. (C) Western blotting analysis of Rga3-2mNeoGreen, Rga4-2mNeoGreen, and Rga6-2mNeoGreen in germinating spores (8 h after germination). Antibodies against mNeonGreen and actin were used. The intensity ratio of mNeonGreen to actin is shown. Three independent experiments were carried out. One-way ANOVA with Tukey HSD Post Hoc test was used to calculate the P values. (D) Transmission electron microscopic (TEM) images of WT and rga6∆ spores growing at the stage of isotropic swelling (3 h after germination). Scale bar, 1 μm. (E) Diagrams showing the four junctions selected for measuring the width of the spore wall (gray circle). The average width of WT and rga6Δ spore cells (i.e., the average width of the spore wall at the four junctions indicated in the diagram) was measured and plotted. Student’s t test was used to calculate the P value. The number (n) of spores analyzed is indicated. Source data are available for this figure: SourceData F3.

