Figure 4.
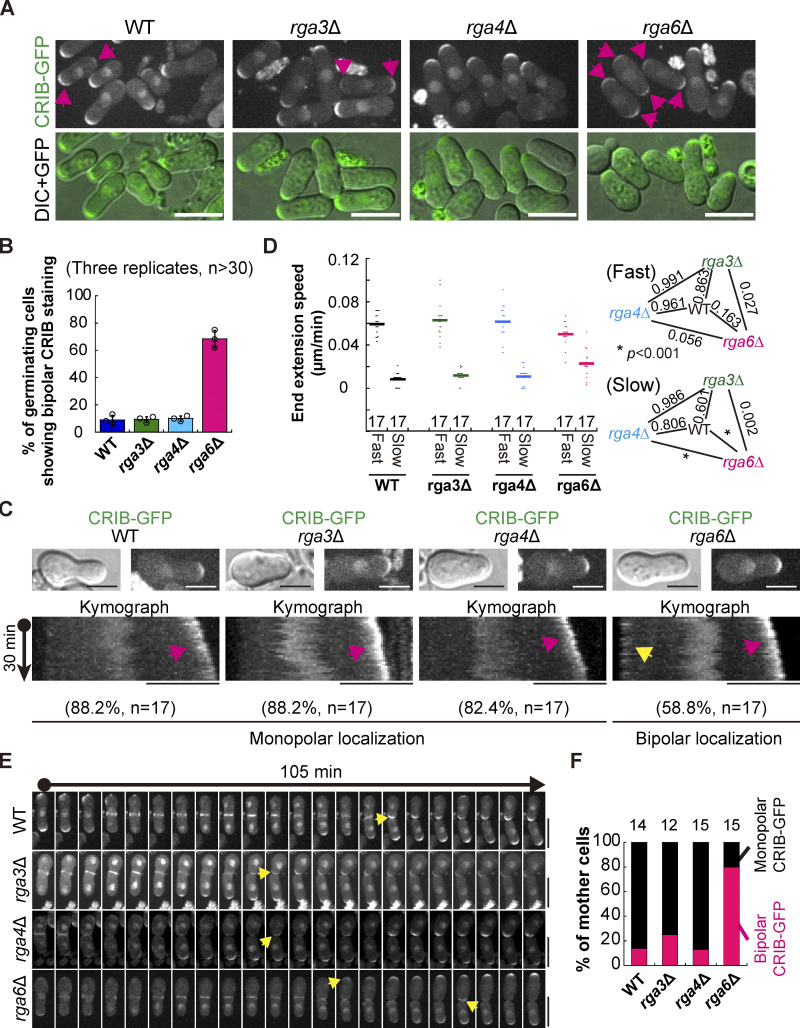
Rga6, but not Rga3 or Rga4, specifies the localization of CRIB-GFP in outgrowing spores. (A) Maximum projection images of outgrowing WT, rga3Δ, rga4Δ, and rga6Δ cells expressing CRIB-GFP. Images were acquired after spores were cultured in YE5S liquid medium for 8 h. Pink arrows indicate cells showing bipolar CRIB-GFP staining. Scale bar, 10 μm. (B) Quantification of the percentage of outgrowing WT, rga3Δ, rga4Δ, and rga6Δ cells showing bipolar CRIB-GFP localization. Three independent experiments were carried out, and more than 30 cells were analyzed for each replicate. (C) Kymograph graphs of CRIB-GFP of representative outgrowing WT, rga3Δ, rga4Δ, and rga6Δ cells. Maximum projection and DIC images of the cell used for constructing the corresponding kymograph graph are shown at the top. Pink and yellow arrows indicate CRIB-GFP at the fast- and slow-growing ends, respectively. Scale bar, 5 μm. Shown below is the percentage of outgrowing cells displaying monopolar CRIB-GFP localization (WT, rga3Δ, and rga4Δ) and bipolar CRIB-GFP localization (rga6Δ), and the number (n) of cells analyzed is indicated. (D) Dot plots of the end extension speed of the indicated outgrowing cells in C. Bars represent the mean, and one-way ANOVA with Tukey HSD post hoc test was used to calculate the P values. The number of cells analyzed is indicated on the x-axis. (E) Time-lapse maximum projection images of outgrowing spores that were completing the first cell division. Yellow arrows indicate the emergence of CRIB-GFP. Scale bar, 10 μm. (F) Quantification of the growth pattern of the indicated parental cells in E. The number (n) of cells analyzed is indicated on each column.

