Figure 5.
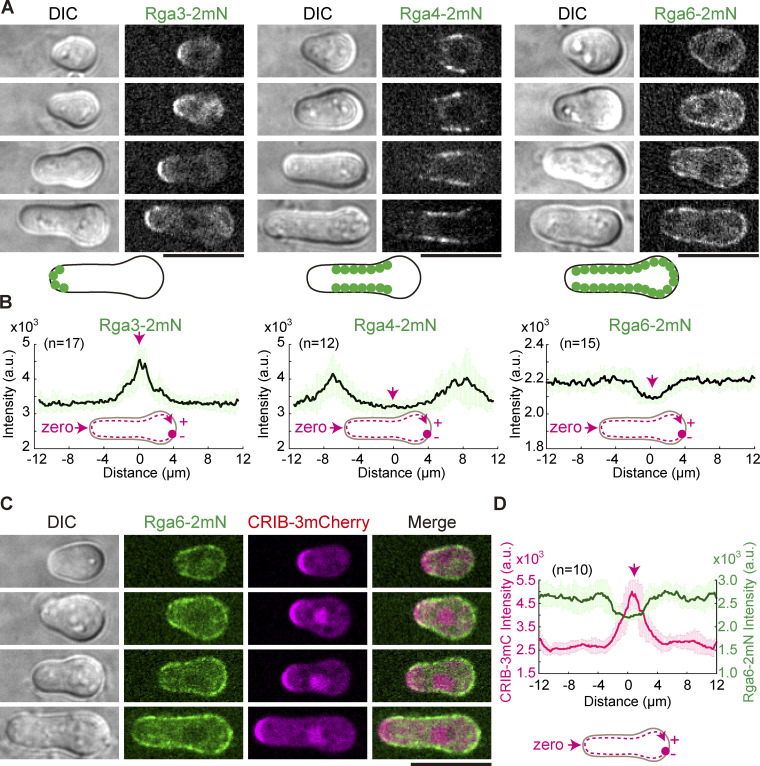
Cortical localization of Rga3, Rga4, and Rga6 in outgrowing cells. (A) Z-slice images of outgrowing cells expressing Rga3-2mNeonGreen, Rga4-2mNeonGreen, or Rga6-2mNeonGreen. Scale bar, 10 μm. Diagrams illustrate the cortical localization of 2mNeonGreen-marked proteins (green filled circles). (B) Plots of the average signal intensity (from the indicated number [n] of cells) of Rga3-2mNeoGreen, Rga4-2mNeoGreen, and Rga6-2mNeoGreen along the cell contour as illustrated by the pink dashed line in the diagram. Zero indicates the geometric center of the growing end while “+” and “−” indicate the positive and negative distances on the x-axis, respectively. Thick lines and error bars represent the mean and SD, respectively. (C) Z-slice images of outgrowing cells expressing CRIB-3mCherry and Rga6-2mNeonGreen. Scale bar, 10 μm. (D) Plots of the average signal intensity (from 10 cells) of CRIB-3mCherry and Rga6-2mNeoGreen along the cell contour as illustrated by the pink dashed line in the diagram. Zero indicates the geometric center of the growing end while “+” and “−” indicate the positive and negative distances on the x-axis, respectively. Thick lines and error bars represent the mean and SD, respectively.

