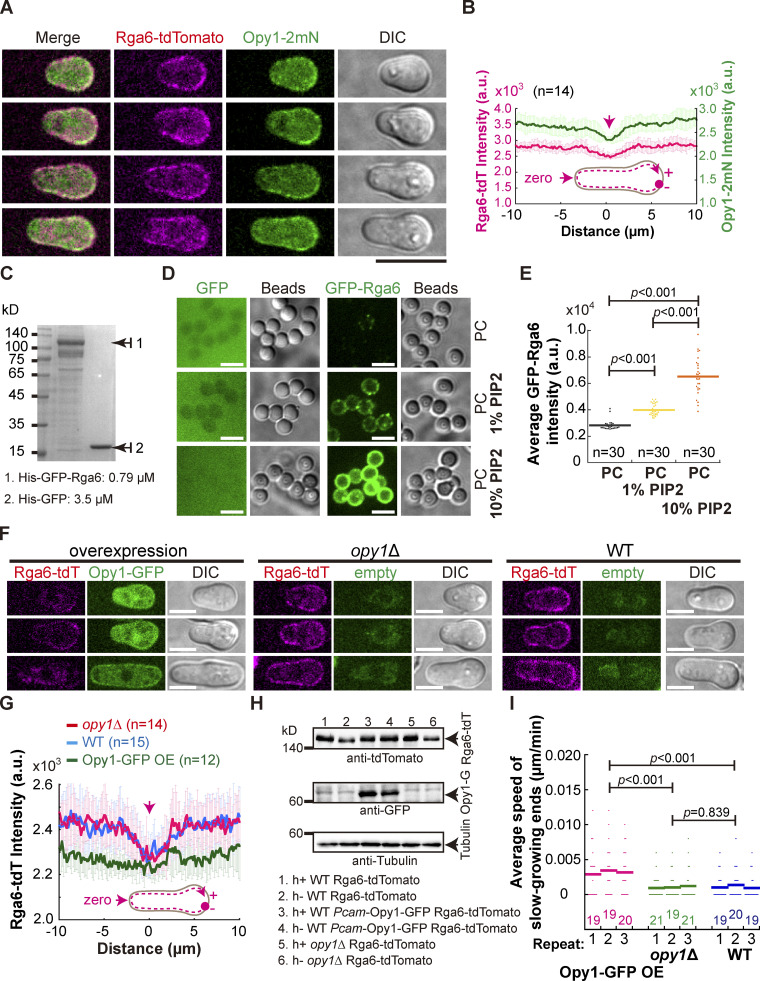
Figure 6.
Rga6 colocalizes with Opy1 on the cell cortex in outgrowing cells. (A) Maximum projection images of outgrowing cells expressing Rga6-tdTomato and Opy1-2mNeonGreen (marking PI[4,5]P2). Scale bar, 10 μm. (B) Plots of the average signal intensity (from 14 cells) of Rga6-tdTomato and Opy1-2mNeonGreen along the cell contour as illustrated by the pink dashed line in the diagram. Zero indicates the geometric center of the growing end while “+” and “−” indicate the positive and negative distances on the x-axis, respectively. Thick lines and error bars represent the mean and SD, respectively. (C) Coomassie-blue staining analysis of recombinant proteins (His-GFP and His-GFP-Rga6) used in the liposome reconstitution assay. Protein concentration is indicated. (D) Representative Z-slice images of lipid-coated silica microsphere beads incubated with the recombinant protein His-GFP or His-GFP-Rga6. Note that liposomes were reconstituted with PC alone, PC+ 1% PI(4,5)P2, or PC+ 10% PI(4,5)P2. Scale bar, 5 μm. (E) Quantification of the intensity of Rga6-GFP signals on the lipid-coated microspheres. Bars represent the mean, and the Wilcoxon-Mann-Whitney Rank Sum test was used to calculate the P values. The number (n) of microspheres analyzed is indicated. a.u., arbitrary units. (F) Z-slice images of the indicated cells (i.e., overexpression of Opy1-GFP, opy1Δ, and WT) expressing Rga6-tdTomato. Scale bar, 5 μm. (G) Average intensity of Rga6-tdTomato along the cell contour as illustrated by the pink dashed line in the diagram. Zero indicates the geometric center of the growing end while “+” and “−” indicate the positive and negative distances on the x-axis, respectively. Thick lines and error bars represent the mean and SD, respectively. The number (n) of cells analyzed is indicated. (H) Western blotting analysis of the indicated cells below the blot graphs. Antibodies against tdTomato, GFP, and tubulin were used. (I) Average extension speed of the slow-growing ends of the three types of cells indicated in F. The speed was measured using kymograph graphs, and end displacements taking place during ∼3 h since outgrowth were used for the calculation. All data points from three independent experiments and the number (n) of spores analyzed are shown. Bars represent the mean. For comparisons between groups, the Wilcoxon-Mann-Whitney Rank Sum test was used to calculate the P values. Source data are available for this figure: SourceData F6.

