Figure S1.
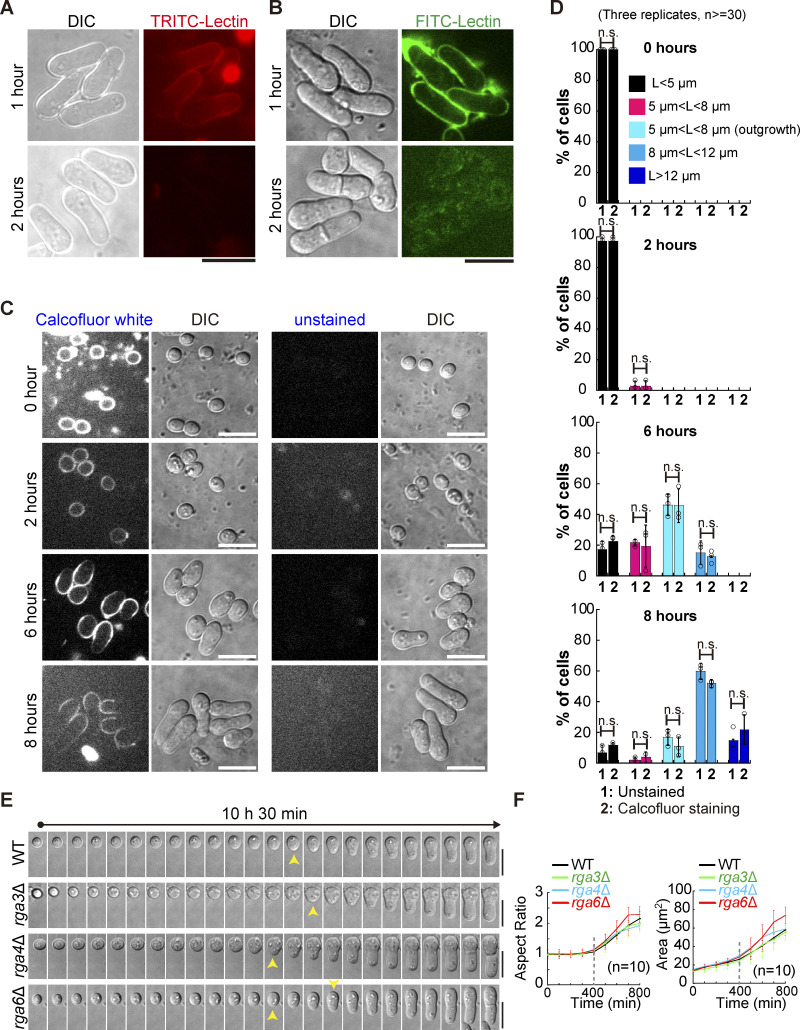
Assessments of spore staining with Lectin and Calcofluor-white and the spore growth by long time-lapse light microscopy (Related to Fig. 2). (A and B) Staining of germinating spores with TRITC-conjugated (A) or FITC-conjugated (B) Lectin. The stained spores were cultured in YE5S liquid medium for 1 or 2 h, followed by confocal microscopic observation. Scale bar, 10 μm. (C) Z-slice (middle) and DIC images of spores stained with or without Calcofluor-white (CFW). The time after the stained spores were cultured in liquid YE5S medium is indicated. Scale bar, 10 μm. (D) Quantification of the indicated category (also see Fig. 2 A) of spores at the indicated time points after the stained spores were cultured in liquid YE5S medium (as shown in C; related to Fig. 2 B). Three independent experiments were carried out, and the number of spores analyzed is not less than 30 for each replicate. The top of the column and the error bar represent the mean and SD, respectively. Statistical analysis was performed by Student’s t test. (E) Time-lapse differential interference contrast (DIC) images of germinating WT, rga3Δ, rga4Δ, and rga6Δ spores (related to Fig. 2, E and F). Yellow arrowheads indicate the start of outgrowth. Note that images were acquired once spores were cultured on YE5S medium pads. Scale bar, 10 μm. (F) Aspect ratio (left) and area (right) of the indicated germinating spores in E over time. Note that outgrowth was detected at ∼400 min after spores were grown on YE5S medium pads. The number (n) of cells analyzed is indicated. Lines and error bars represent the mean and SD, respectively.

