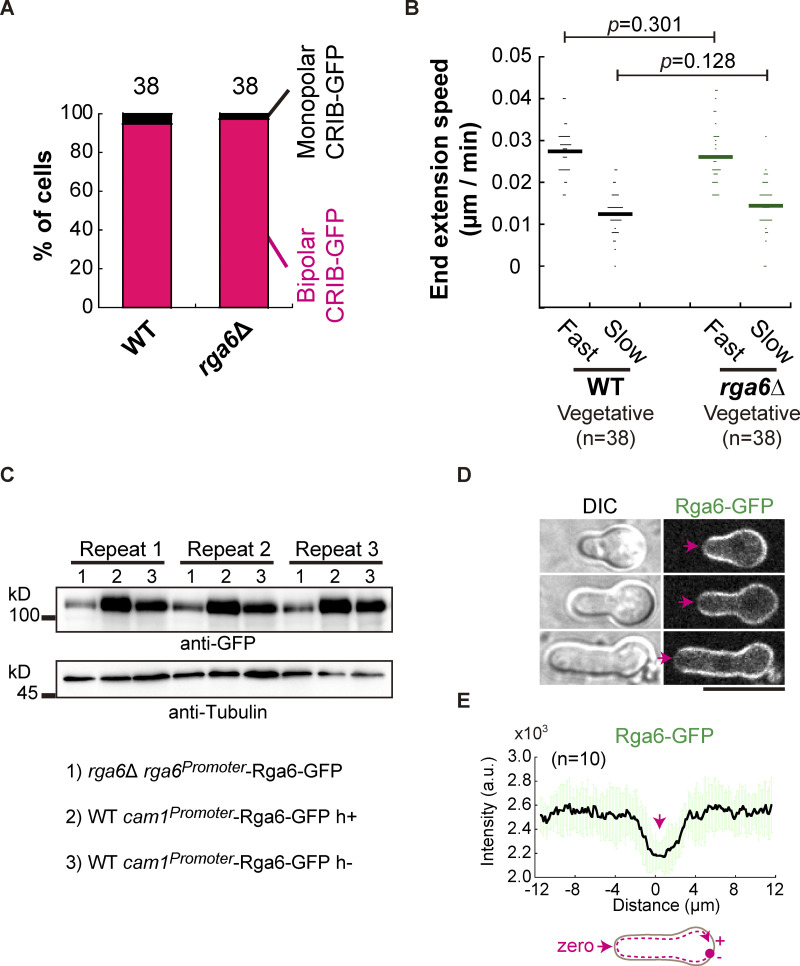
Figure S2.
The effect of the absence of Rga6 on vegetative cell growth and the effect of Rga6 overexpression on spore outgrowth. (A) Quantification of staining of the bipolar and monopolar CRIB-GFP at cell ends in WT and rga6Δ vegetative cells. The number of cells analyzed is indicated. (B) Extension speed of the fast- and slow-growing ends of WT and rga6Δ vegetative cells. Bars represent mean, and the number (n) of cells analyzed is indicated. Statistical analysis was performed by Student’s t test. (C) Western blotting analysis of Rga6-GFP expressed from its own promoter in rga6∆ cells or from a cam1 promoter in WT cells (i.e., overexpression). Repeat indicates the three replicates. Antibodies against GFP and Tubulin were used. (D) Z-slice (middle) images of outgrowing spores expressing Rga6-GFP from the cam1 promoter. Arrows indicate the growing tip where relatively less signals of Rga6-GFP were detected. Scale bar, 10 μm. (E) Plots of the signal intensity of Rga6-GFP along the cell contour as illustrated by the pink dashed line in the diagram. Zero indicates the geometric center of the growing end while “+” and “−” indicate the positive and negative distances on the x-axis, respectively. Thick lines and error bars represent the mean and SD, respectively. Source data are available for this figure: SourceData FS2.

