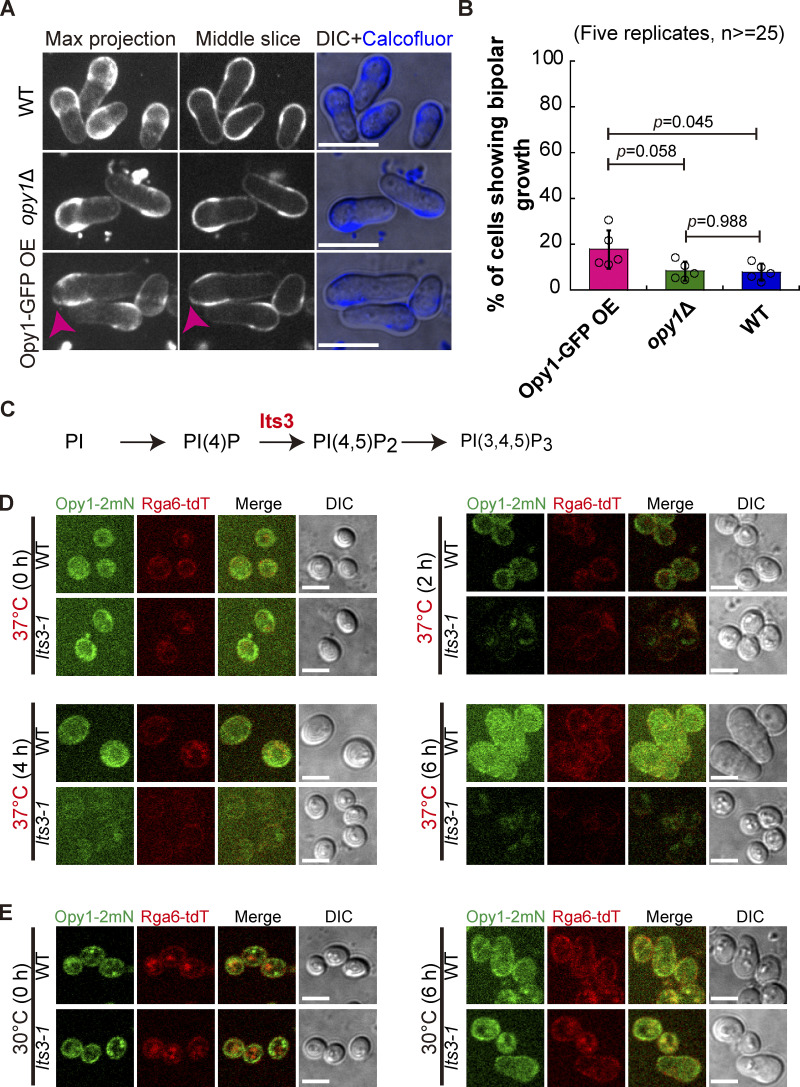
Figure S3.
The effect of the absence of Opy1 or overexpression of Opy1 on spore outgrowth and the localization of Opy1-2mNeonGreen and Rga6-tdTomato in its3-1 spores (Related to Fig. 6). (A) Maximum projection and Z-slice (Middle) images of WT, opy1Δ, and Opy1-overexpressing spores that were stained with Calcofluor-white. Note that stained spores were cultured in Calcofluor-white-free rich medium for 8 h before microscopic analysis. Pink arrowheads indicate bipolar growth of outgrowing spores. Scale bar, 10 μm. (B) The percentage of germinating WT, opy1Δ, and Opy1-overexpressing spores that underwent bipolar growth, as shown in A. Five independent experiments were carried out, and ≥ 25 spores were analyzed for each replicate. The top of the column and the error bar are the mean ± SD. One-way ANOVA with Tukey HSD post hoc test was used to calculate the P values. (C) Diagram showing the function of Its3 in synthesizing PI(4,5)P2. (D) Maximum projection images of Opy1-2mNeonGreen and Rga6-tdTomato-expressing WT and its3-1 spores cultured at the restricted temperature 37°C for the indicated time. Scale bar, 5 μm. (E) Maximum projection images of Opy1-2mNeonGreen and Rga6-tdTomato-expressing WT and its3-1 spores cultured at the permissive temperature 30°C for the indicative time. Note that both WT and its3-1 spores germinated at the permissive temperature. Scale bar, 5 μm.

