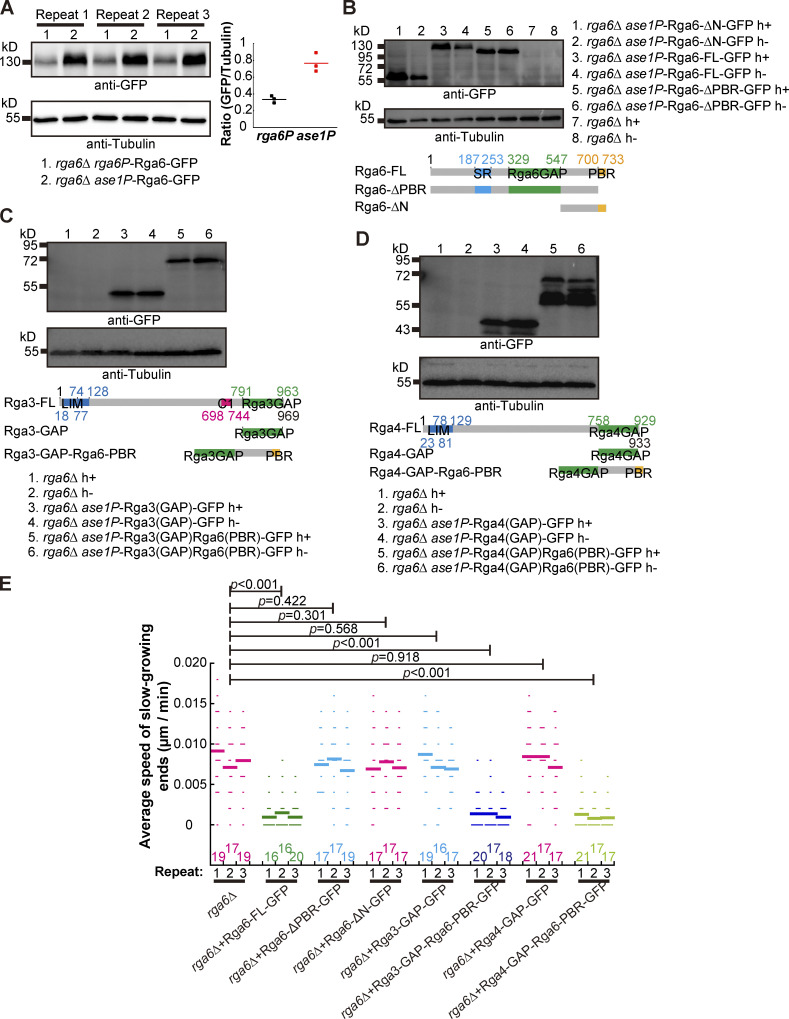
Figure S4.
Testing the expression of Rga6 truncation mutants and chimera constructs and the effect of the Rga6 truncation mutants and chimeras on spore outgrowth (Related to Fig. 7). (A) Western blotting analysis of expression of Rga6-FL from its own promoter and from an ase1 promoter in rga6∆ cells. Three cultures for rga6∆ rga6p-Rga6-GFP and rga6∆ ase1p-Rga6-GFP cells were collected for analysis. Antibodies against GFP and tubulin were used. Intensity ratio of GFP over Tubulin is shown on the right of the blot. (B) Western blotting analysis of expression of Rga6-FL, Rga6-∆N, and Rga6-∆PBR in rga6∆ cells. Antibodies against GFP and Tubulin were used. (C) Western blotting analysis of expression of Rga3(GAP) and Rga3(GAP)Rga6PBR in rga6∆ cells. Antibodies against GFP and Tubulin were used. (D) Western blotting analysis of expression of Rga4(GAP) and Rga4(GAP)Rga6PBR in rga6∆ cells. Antibodies against GFP and Tubulin were used. (E) Average extension speed of the slow-growing ends of the indicated germinating cells shown in Fig. 7. The speed was measured using kymograph graphs, and end displacements taking place during ∼3 h since outgrowth were used for the calculation. All data points from three independent experiments and the number (n) of spores analyzed is shown. Bars represent the mean. For comparisons with rga6∆ spores, the Wilcoxon-Mann-Whitney Rank Sum test was used to calculate the P values. Source data are available for this figure: SourceData FS4.

