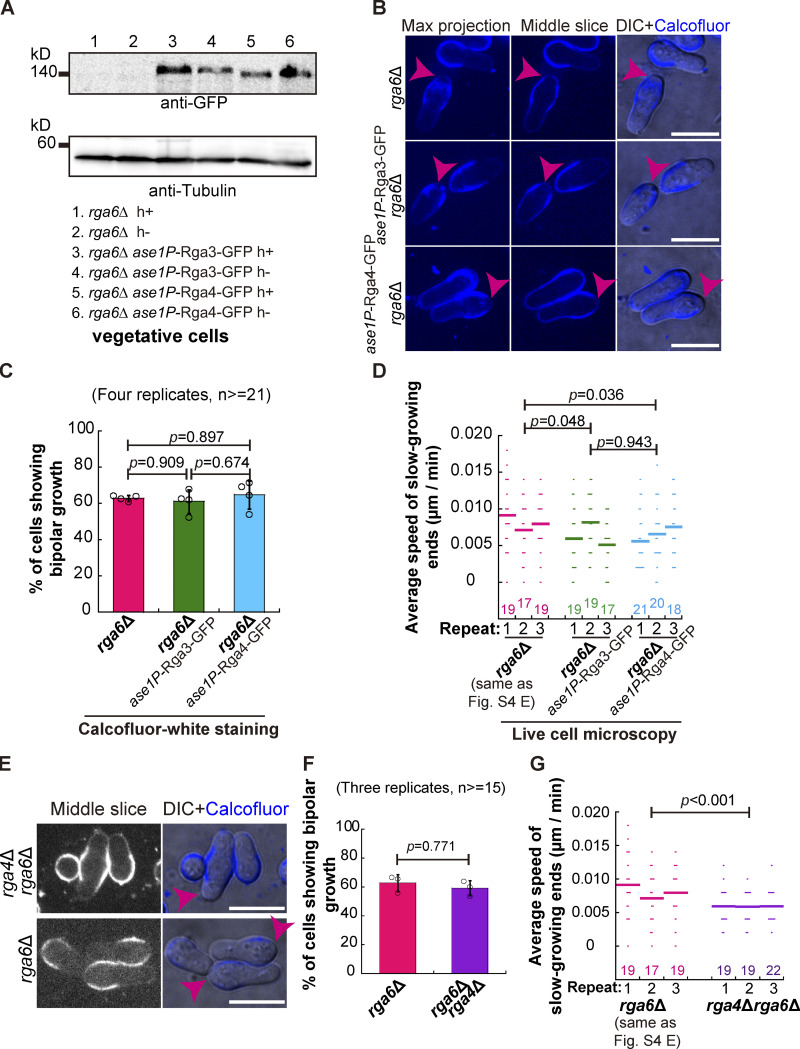
Figure S5.
The effects of overexpression of Rga3 or Rga4 and the absence of both Rga4 and Rga6 on spore outgrowth. (A) Western blotting analysis of expression of Rga3-GFP and Rga4-GFP from the ase1 promoter in rga6∆ cells. Antibodies against GFP and Tubulin were used. (B) Maximum projection and Z-slice (Middle) images of rga6Δ and Rga3-GFP-overexpressing or Rga4-GFP-overexpressing rga6∆ spores that were stained with Calcofluor-white. Images were acquired after the stained spores were cultured in liquid YE5S medium for 8 h. Pink arrowheads indicate bipolar growth of outgrowing spores. Scale bar, 10 μm. (C) The percentage of the indicated spores that underwent bipolar growth, as shown in B. Note that four independent experiments were carried out, and ≥21 cells were analyzed for each replicate. One-way ANOVA with Tukey HSD Post Hoc test was used to calculate the P values. (D) Average extension speed of the slow-growing ends of the indicated cells. The speed was measured using kymograph graphs, and end displacements taking place during ∼3 h since outgrowth were used for the calculation. All data points from three independent experiments and the number (n) of spores analyzed is shown. Bars represent the mean. For comparisons between groups, the Wilcoxon-Mann-Whitney Rank Sum test was used to calculate the P values, and for convenient comparison, and the data for rga6∆ in Fig. S4 E was used here. (E) Z-slice (Middle) images of rga6Δ and rga4Δrga6Δ spores that were stained with Calcofluor-white. Images were acquired after the stained spores were cultured in liquid YE5S medium for 8 h. Pink arrowheads indicate bipolar growth of outgrowing spores. Scale bar, 10 μm. (F) The percentage of the indicated spores that underwent bipolar growth, as shown in E. Note that three independent experiments were carried out, and ≥ 15 cells were analyzed for each replicate. Student’s t test was used to calculate the P value. (G) Average extension speed of the slow-growing ends of the indicated cells. The speed was measured using kymograph graphs, and end displacements taking place during ∼3 h since outgrowth were used for the calculation. All data points from three independent experiments and the number (n) of spores analyzed is shown. Bars represent the mean. For comparisons between groups, the Wilcoxon-Mann-Whitney Rank Sum test was used to calculate the P values, and for convenient comparison, the data for rga6∆ in Fig. S4 E was used here. Source data are available for this figure: SourceData FS5.

