
Figure 4. Overexpressed stable Erg1 mutants form foci and disrupt the ER morphology.
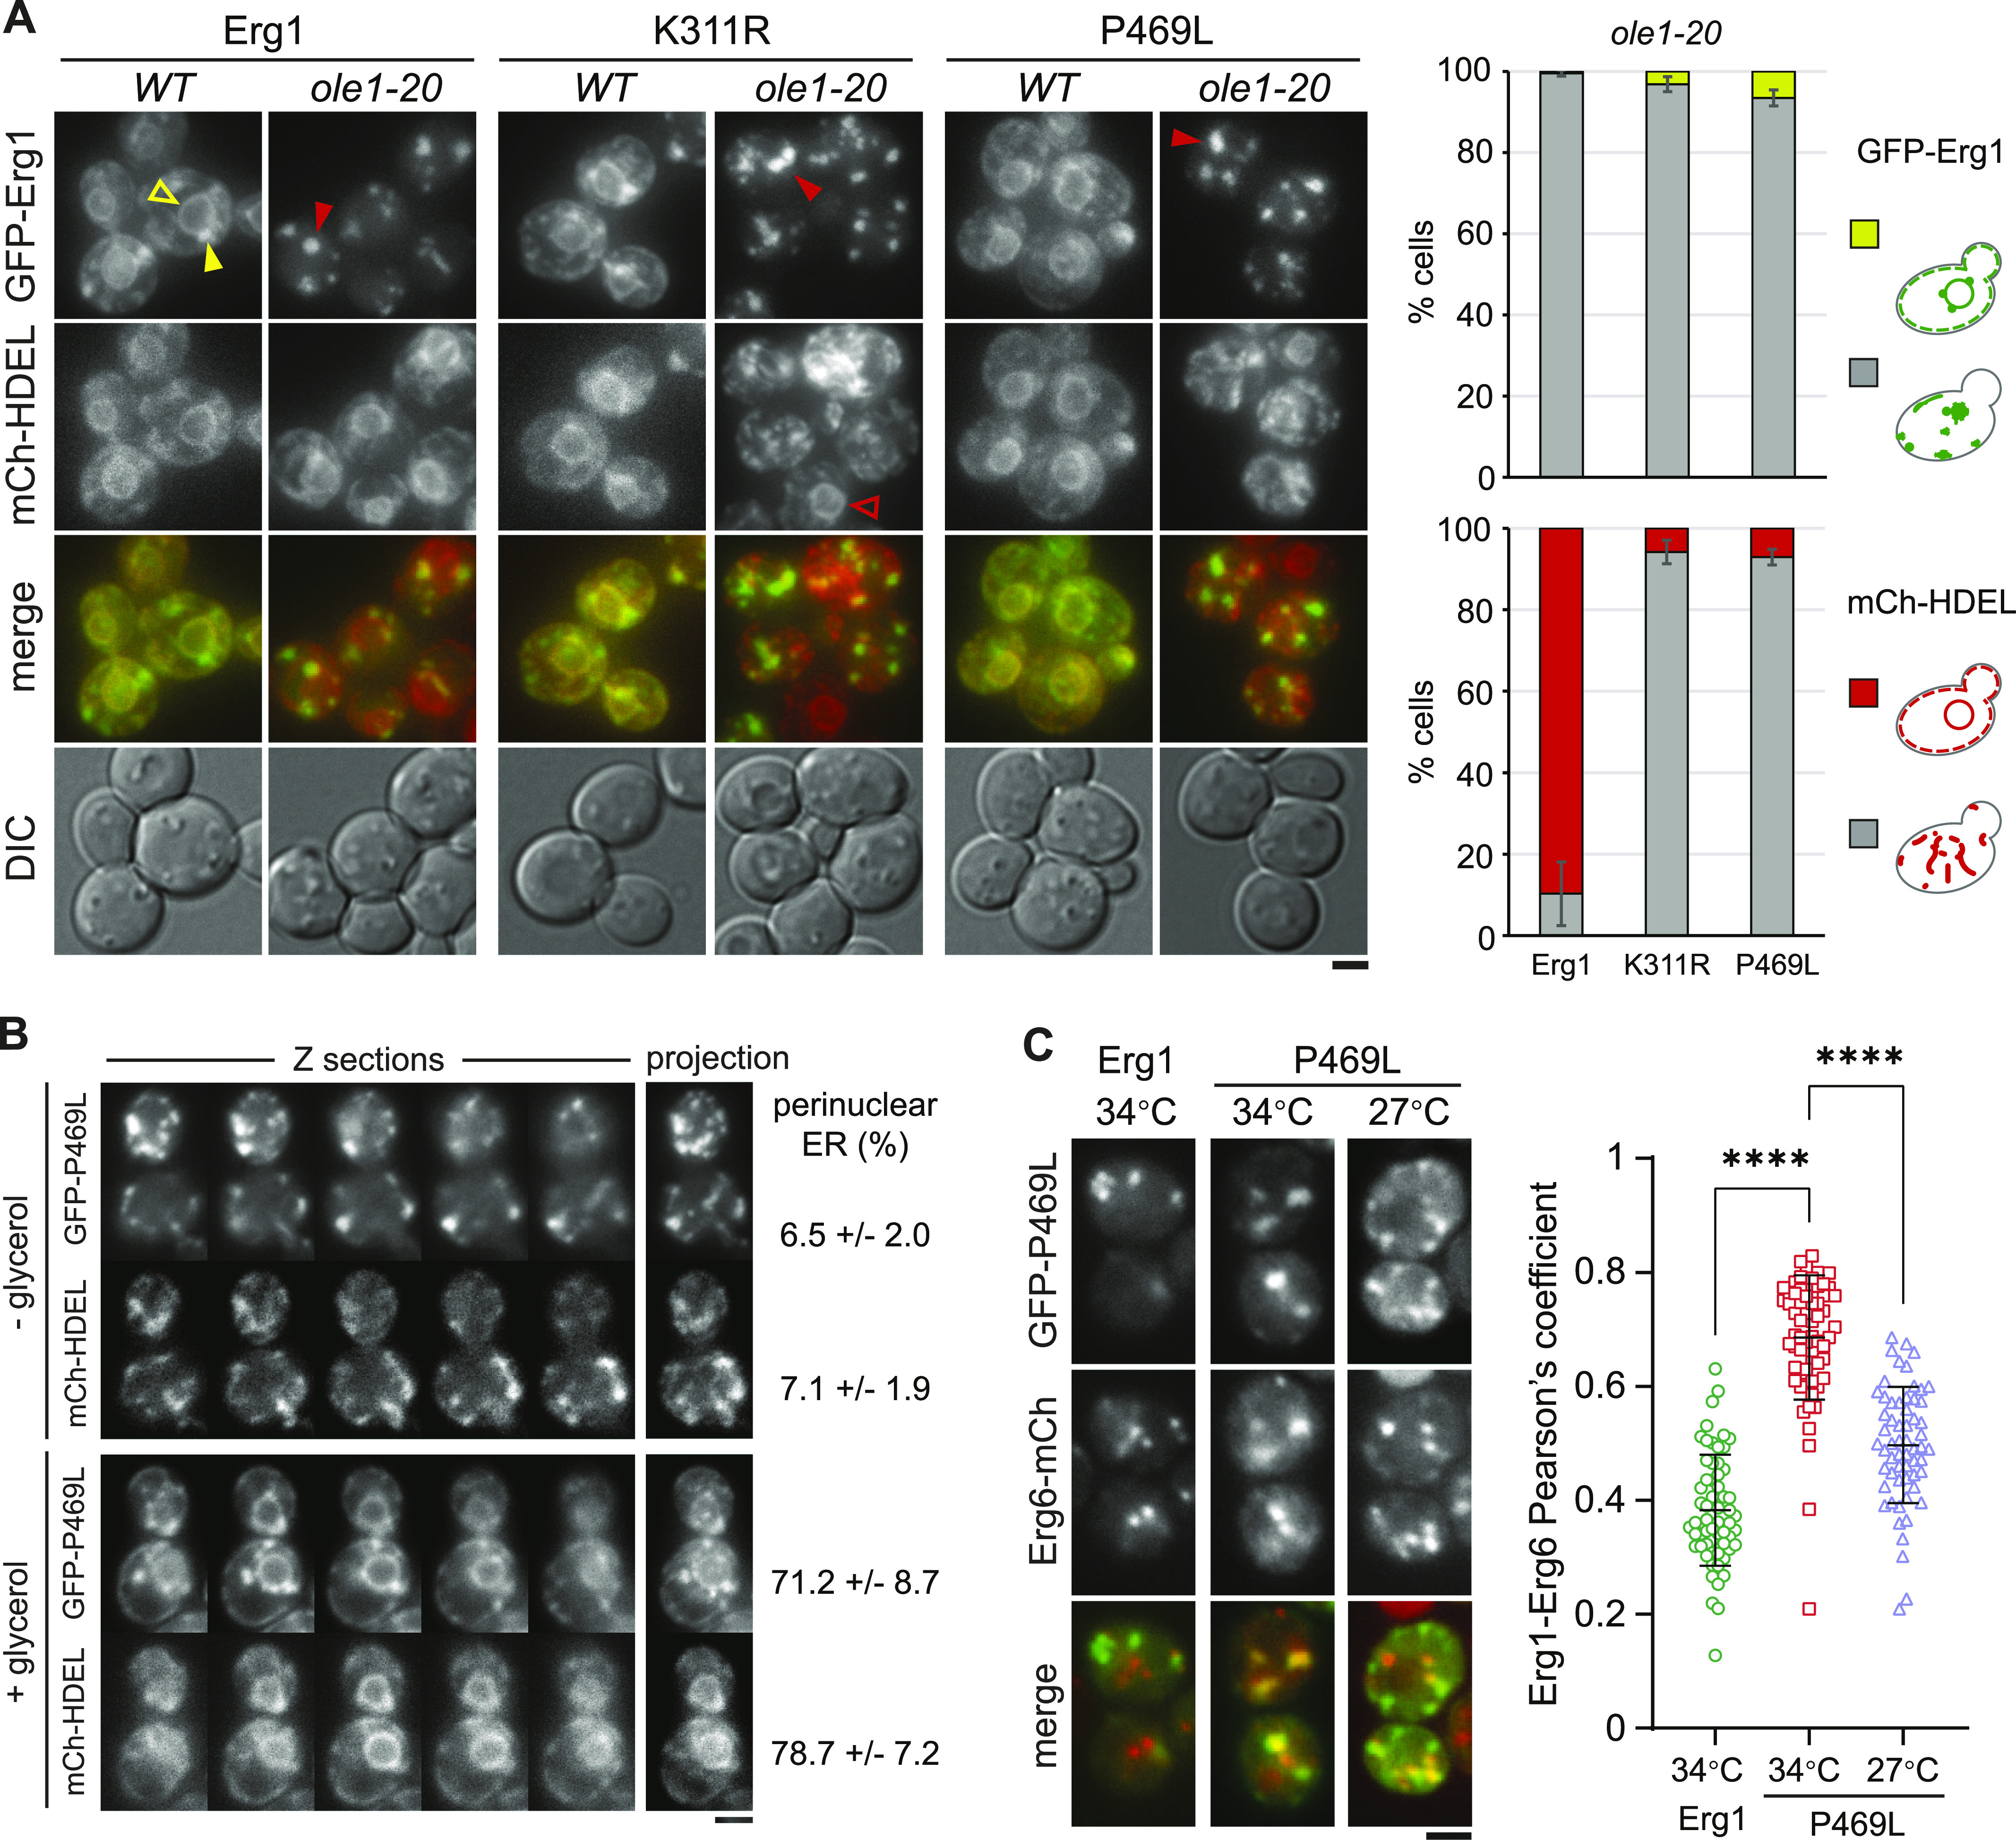
(A) GFP-tagged Erg1, Erg1(K311R), and Erg1(P469L) were expressed from the GAL1 promoter at 34°C for 3 h in WT and ole1-20 cells co-expressing mCh-HDEL. Projections of Z-stack fluorescence images are shown. Scale bar, 2 µm. The phenotypes of aberrant protein distribution in ole1-20 were scored and presented as the mean ± SD from three experiments (n > 200 cells for each sample). Open yellow arrowhead, typical perinuclear signal of GFP-Erg1; closed yellow arrowhead, GFP-Erg1 puncta at the LD; closed red arrowhead, representatives of large GFP-Erg1 foci; and open red arrowhead, normal perinuclear mCh-HDEL in an ole1-20 cell without K311R expression. (B) GFP-Erg1(P469L) expression was induced with galactose in ole1-20 in the absence or presence of 10% glycerol at 34°C for 3 h. Z-sections and projection images are shown. Scale bar, 2 µm. Cells were scored for the perinuclear ER signal of GFP-Erg1(P469L) and mCh-HDEL and presented as the mean ± SD from three experiments (n > 200 cells for each sample). (C) GFP-Erg1 or GFP-Erg1(P469L) was induced in ole1-20 expressing Erg6-mCh at the indicated temperatures. Projection images are shown. Scale bar, 2 µm. Pearson’s colocalization coefficient was determined and is shown as the median ± SD (n = 60 cells for each). ****P < 0.0001 (t test).