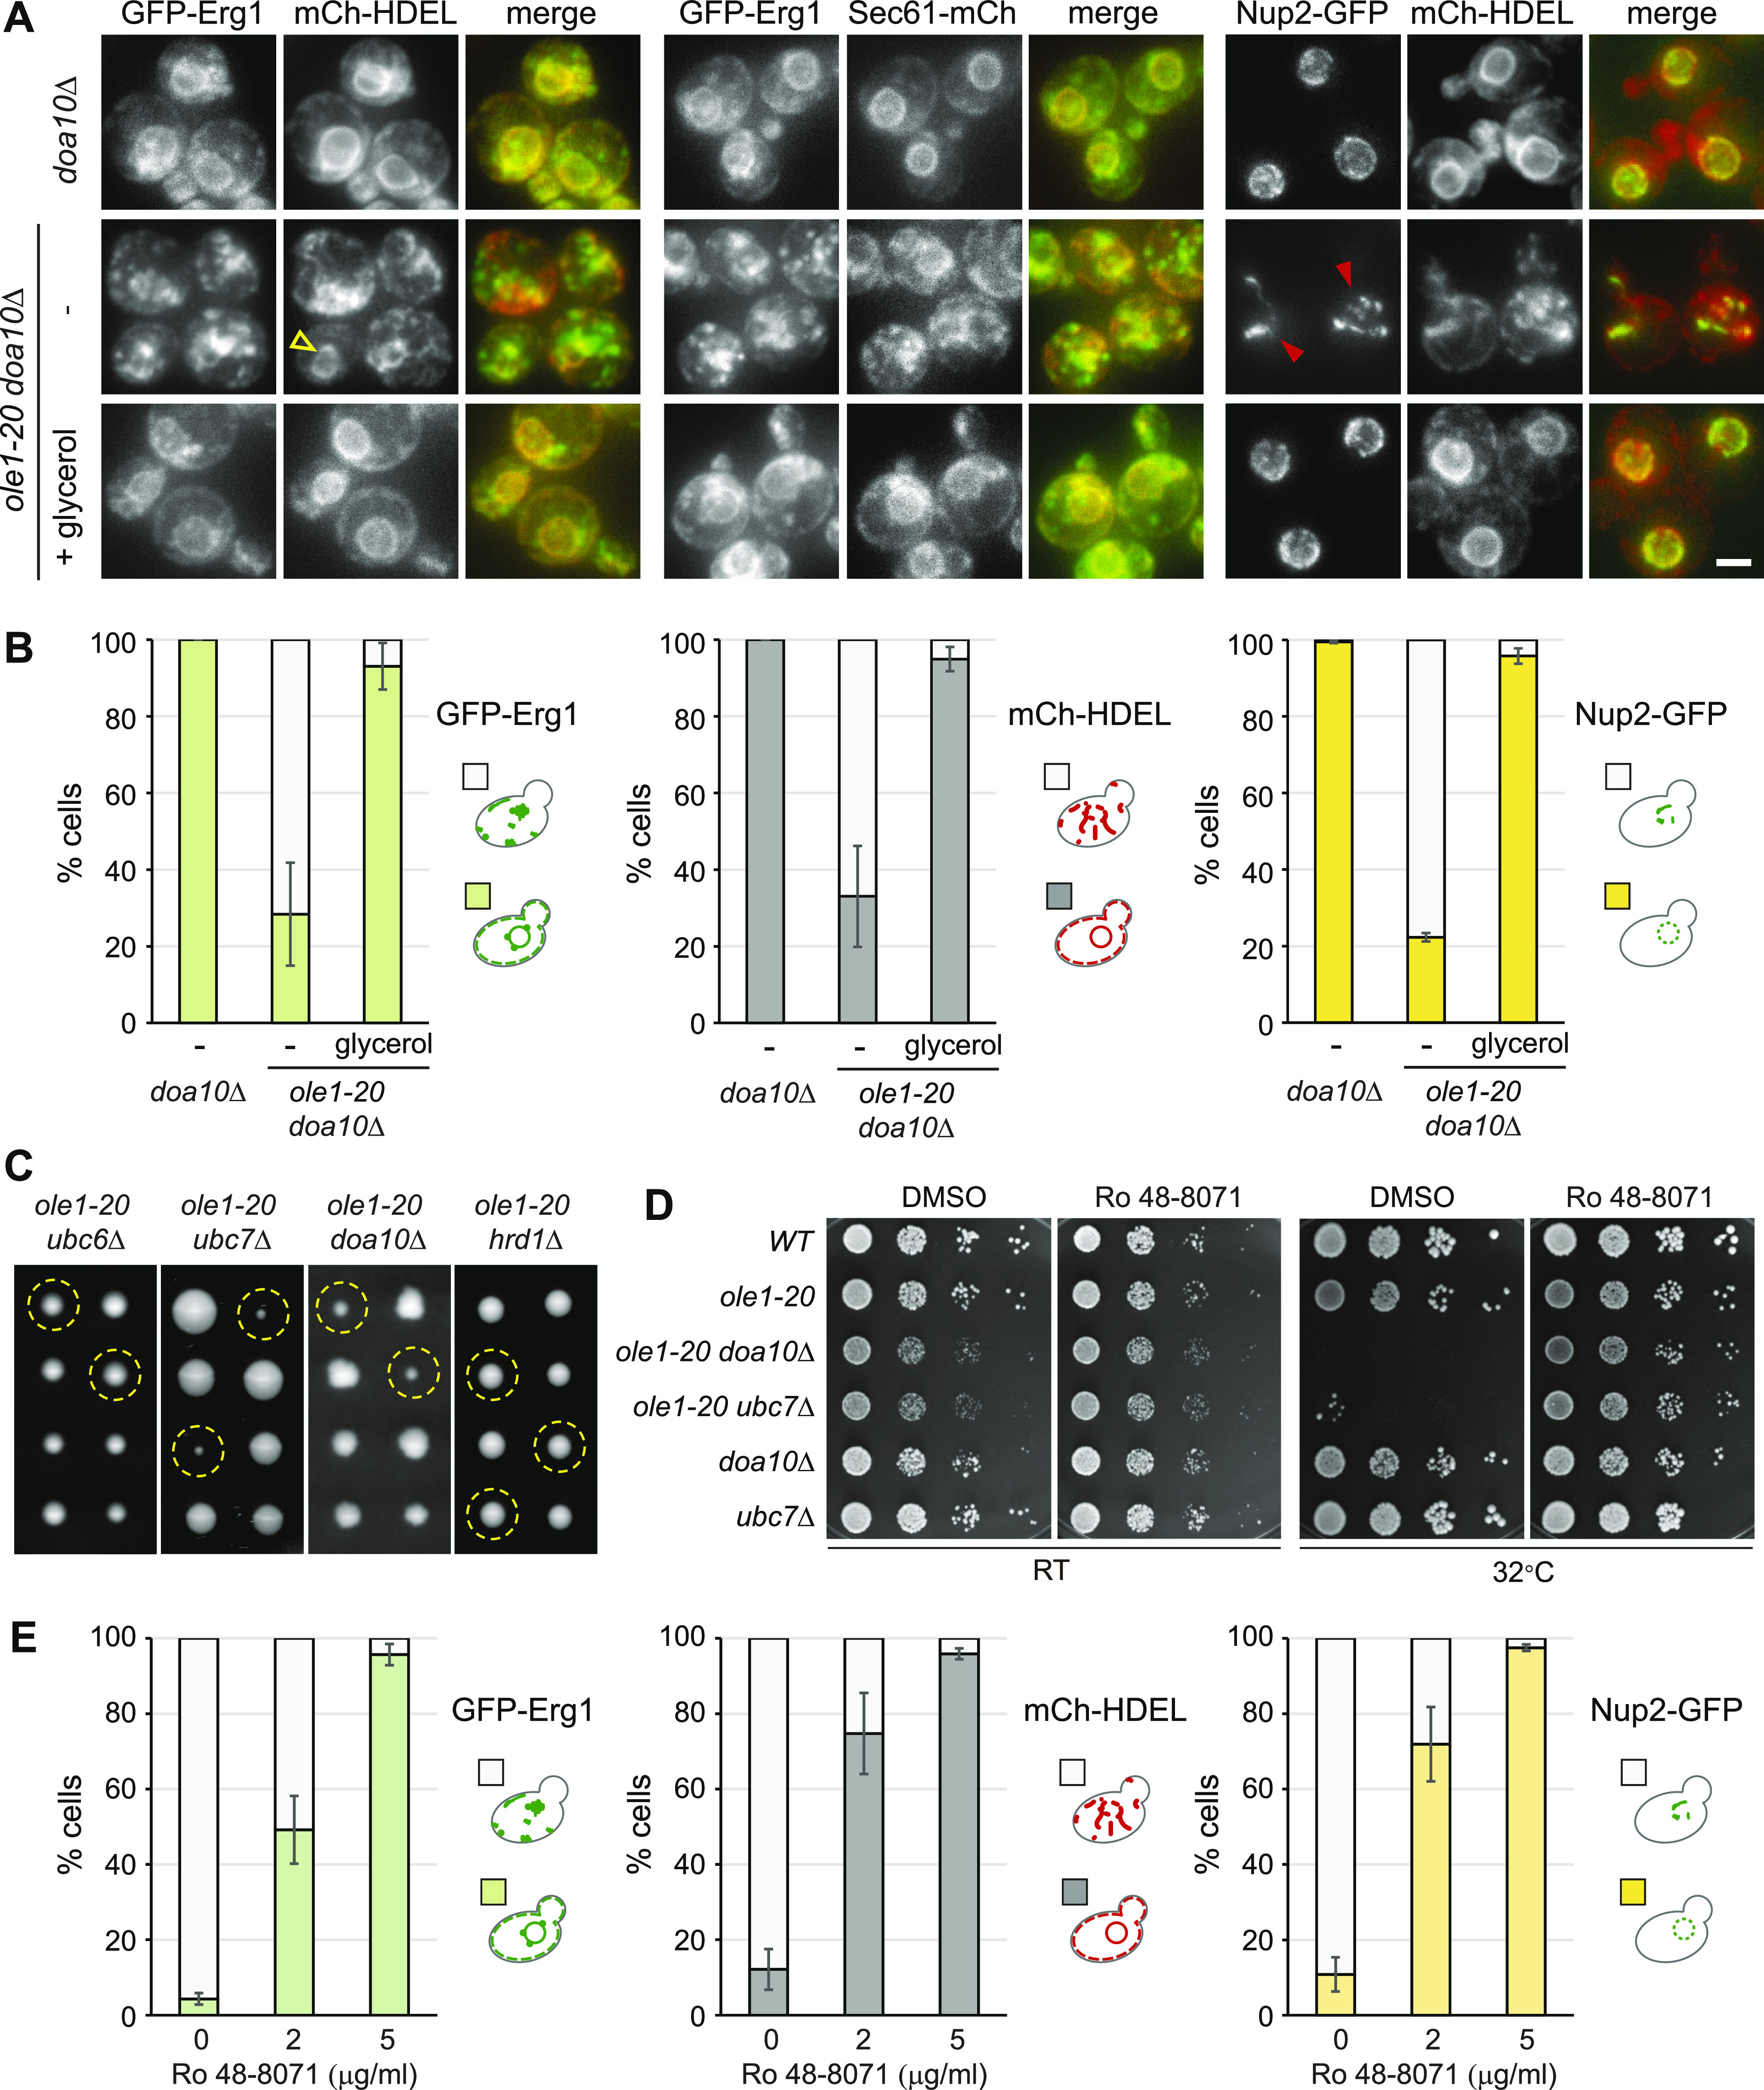
Figure 6. Doa10 is required for ER integrity in ole1-20.

(A, B) doa10Δ and ole1-20 doa10Δ cells expressing indicated GFP- or mCh-tagged proteins were grown at 34°C for 3 h, in the absence or presence of glycerol. Projection images are shown. Scale bar, 2 µm. (B) Cells were scored for the phenotypes described in the diagram and are shown as the mean ± SD, from three experiments for GFP-Erg1 and mCh-HDEL and two experiments for Nup2-GFP (n > 200 cells for each sample). Open yellow arrowhead indicates the perinuclear mCh-HDEL signal in an ole1-20 doa10Δ cell, whereas other cells in the field show a disorganized pattern without the discernible perinuclear signal. Closed red arrowheads indicate clustered Nup2 in the cytoplasmic ER. (C) Two sets of tetrads each from the indicated heterozygous double mutants are shown. Yellow dash circles indicate the spores carrying double mutations. (D) Cells of indicated genotypes were serially diluted and spotted on YPD plates containing DMSO or 200 ng/ml of Ro 48-8071 and incubated at RT or 32°C. (E) ole1-20 doa10Δ cells expressing indicated GFP- or mCh-tagged proteins were grown at 34°C for 4 h, in the absence or presence of Ro 48-8071 at the indicated concentration. Cells were scored for the phenotypes in the diagram and are shown as the mean ± SD from three experiments (n > 200 cells for each sample).
