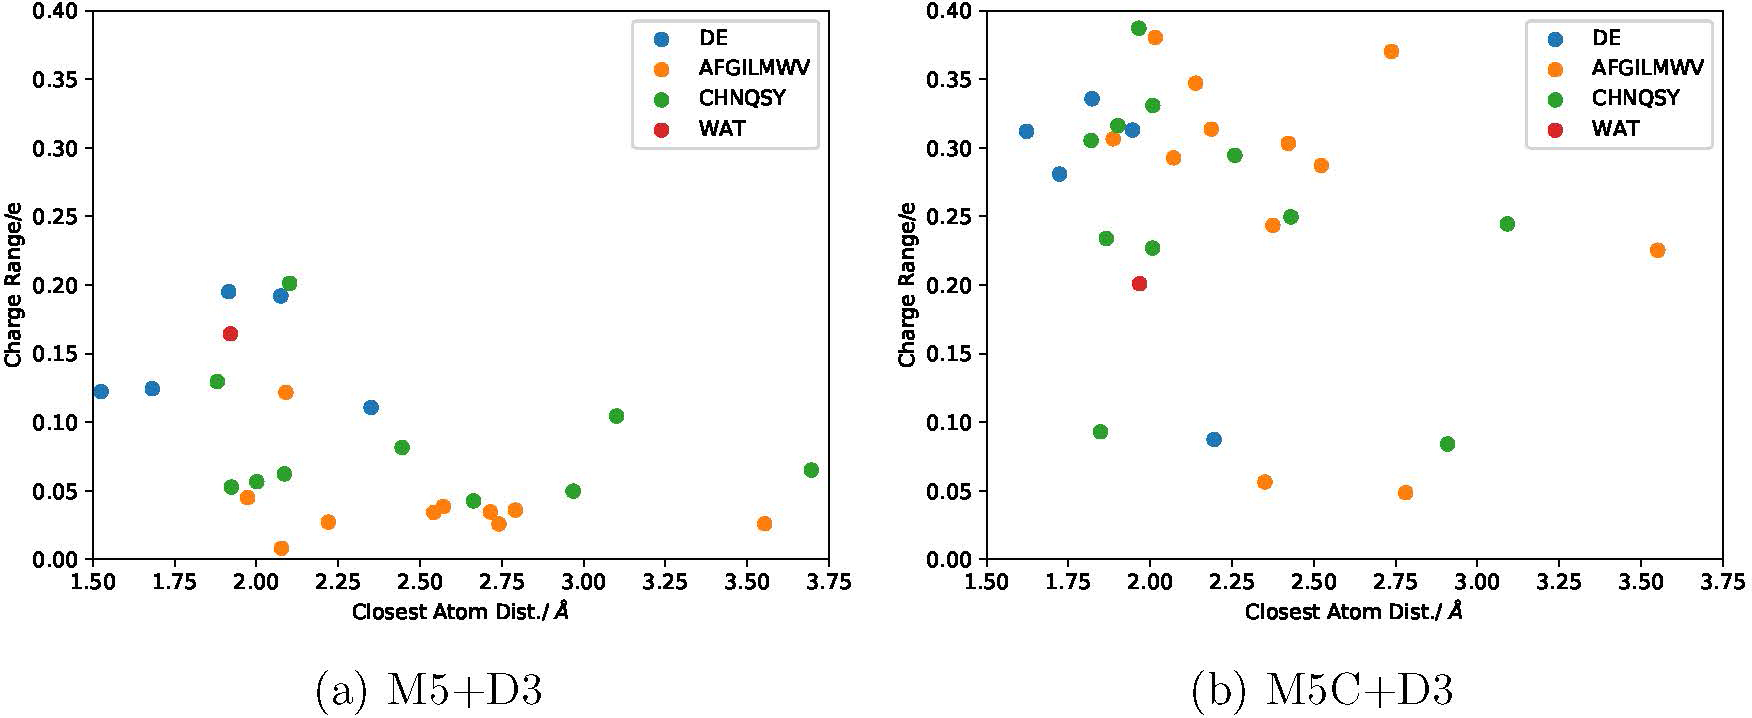
Figure 10:

The range of total charge (i.e., maximum deviation from the integer reference) per residue from (a) M5+D3 and (b) M5C+D3 simulations; for the latter, the charges include backbone contributions. The charge range is plotted as a function of the closest distance of the residue to either SAM, CAT or MG. Charges are color coded into negatively charged (blue), non-polar (orange), polar (green), positively charged (red), and water (purple). All charges are DFTB3 Mulliken charges.
